
Figure 3.
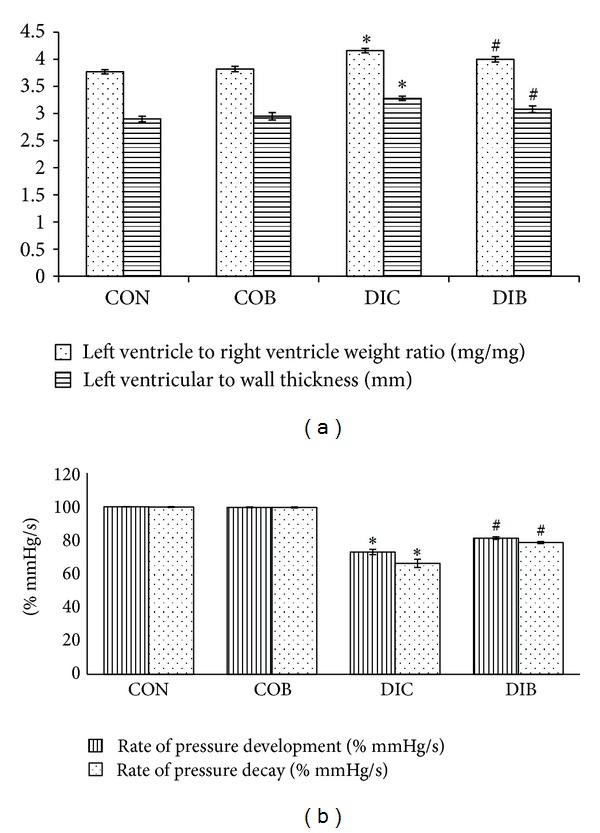
Effect of buspirone on (a) LVW/RVW ratio and LV wall thickness and (b) rate of pressure development and rate of pressure decay. *Significantly different from normal control (P < 0.05). #Significantly different from diabetic control (P < 0.05). Each bar represents mean ± SEM of 6 experiments. CON: normal control, COB: control treated with buspirone, DIC: diabetic control, and DIB: diabetic treated with buspirone.