
Figure 4.
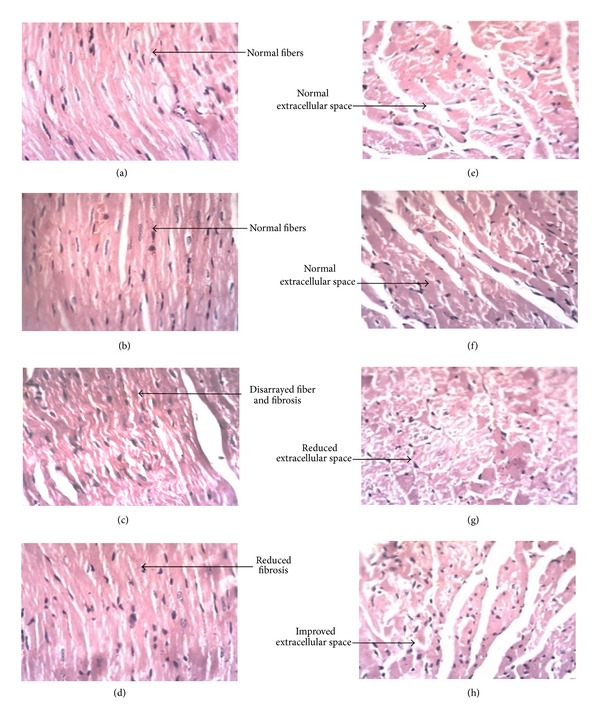
Representative figures of cardiac fibres: (a) normal control; (b) control treated with buspirone; (c) diabetic control; (d) diabetic treated with buspirone and cariomyocytes; (e) normal control; (f) control treated with buspirone; (g) diabetic control; (h) diabetic treated with buspirone.