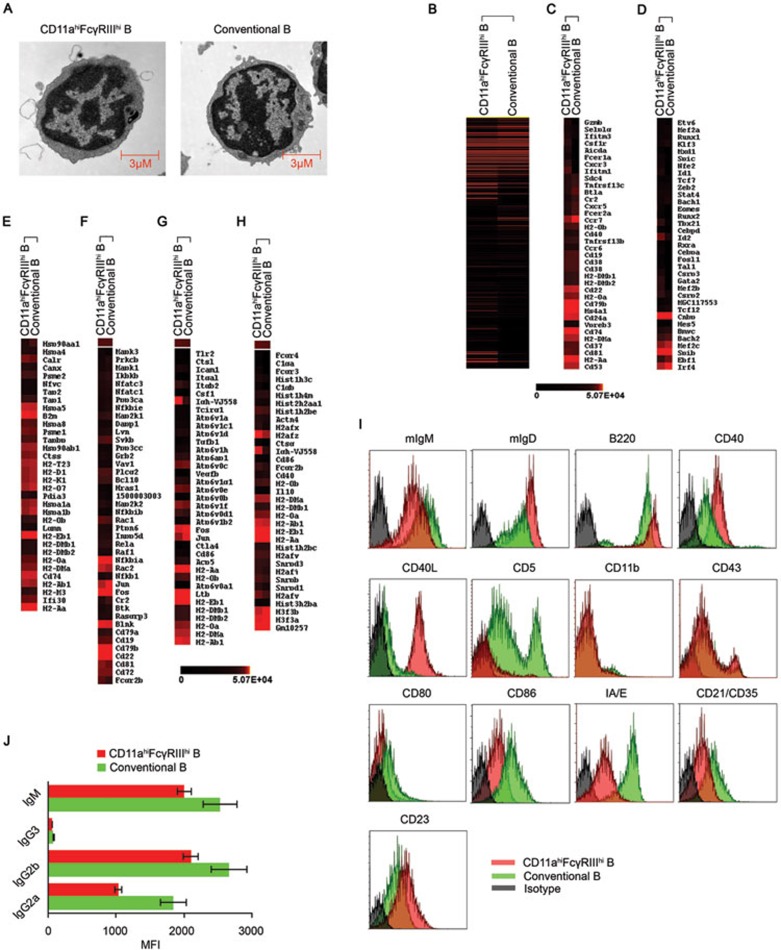
Figure 2.
Morphological and gene signature characteristics of the CD11ahiFcγRIIIhi B cells. C57BL/6 mice were infected with 2 × 10⁶ LM. CD11ahiFcγRIIIhi B cells and CD11aloFcγRIII− conventional B cells were sorted from the splenocytes of the infected mice 3 days later. (A) Electron microscopic observation of CD11ahiFcγRIIIhi and conventional B cells. (B) Unsupervised clustering analysis of differentially expressed genes of the CD11ahiFcγRIIIhi and conventional B cells based on microarray data. Red and black correspond to high and low expression levels, respectively. (C, D) Heat-map of clustering analysis of differentially expressed cellular antigens and transcription factors in the CD11ahiFcγRIIIhi and conventional B cells. The gene symbols are listed. (E-H) Highly expressed genes in the CD11ahiFcγRIIIhi B cells were subjected to a cluster analysis with regard to the antigen processing and presentation pathway, mmu04612 (E), B cell receptor signaling pathway, mmu04662 (F), rheumatoid arthritis, mmu05323 (G), and systemic lupus erythematosus, mmu05322 (H), based on the KEGG database. The gene symbols are listed. (I) The surface markers of CD11ahiFcγRIIIhi and conventional B cells. (J) Secretion of immunoglobulins by CD11ahiFcγRIIIhi and conventional B cells after stimulation with 1 μg/ml LPS for 24 h. Data shown represent the mean ± SD. *P < 0.05.

