Figure 3.
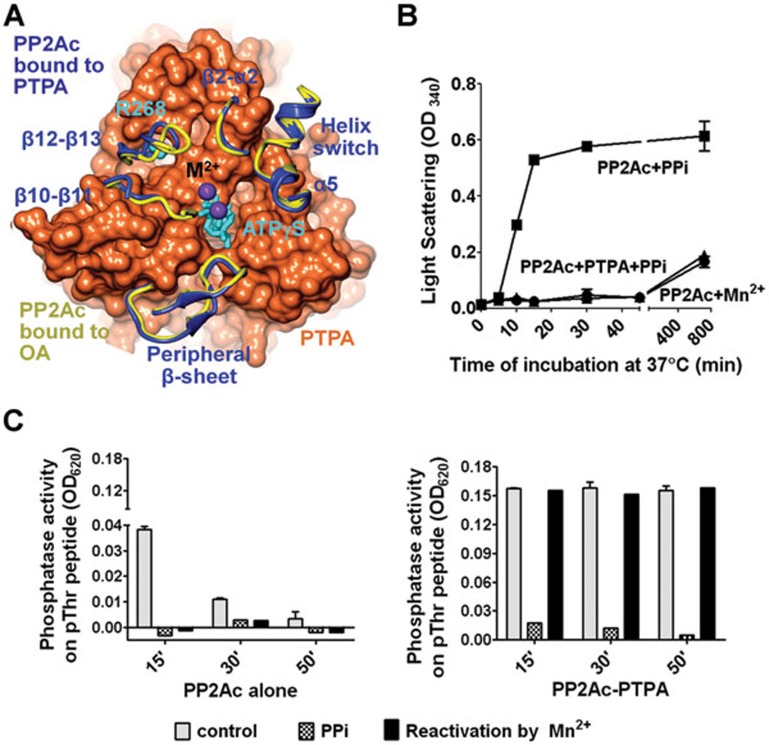
Restriction of the PP2Ac active site conformation by PTPA. (A) Contacts between the structural elements near the PP2Ac active site (ribbon, blue) and PTPA surface valleys (surface, orange). Arg268 of PP2Ac and ATPγS are in cylinder and colored cyan. Structural overlay with PP2Ac bound to okadaic acid (yellow, PDB code: 3IE4) shows a slightly opened active site conformation of the PTPA-bound PP2Ac. Catalytic metal ions are indicated by purple spheres. (B) Light scattering detected aggregation of PP2Ac upon PPi treatment (PP2Ac + PPi), which was suppressed by the presence of PTPA (PP2Ac + PTPA + PPi). (C) The phosphatase activity of PP2Ac after incubation at 37 °C for the indicated duration with and without PPi and in the presence (right) and absence (left) of PTPA, followed by re-activation by Mn2+. For panels B-C, experiments were repeated three times; representative results are shown.

