Figure 6.
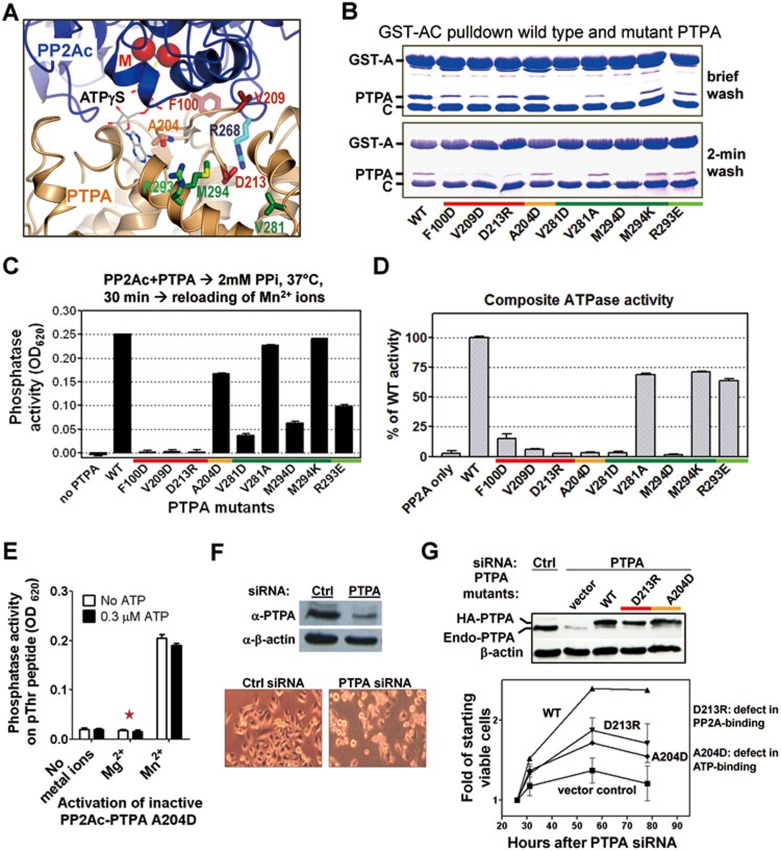
Site-directed mutagenesis of PTPA. (A) PTPA residues mutated shown on the structure of the PP2A-PTPA-ATPγS complex. Residues at the interface with PP2A and ATP are colored red and coral, respectively. Residues outside the interface whose mutations have no effect and those whose mutations distort protein conformations are colored green and dark green, respectively. The same color scheme for PTPA mutants is used in panel B-D and G. (B) Pull-down assay determined interactions between GST-tagged PP2A core enzyme (AC) and wild-type (WT) or mutant PTPA. (C) Stabilization of PP2Ac during PPi treatment by WT or mutant PTPA followed by reactivation by Mn2+ (100 μM). (D) The composite ATPase activity of PP2Ac and WT or mutant PTPA. (E) Activation of PP2Ai-PTPA bearing PTPA mutation, A204D, by 100 μM metal ions in the presence and absence of ATP (0.3 μM). (F) PTPA knockdown in HeLa cells by siRNA. Reduced PTPA level (top) and cell phenotype (bottom) are shown. (G) The ability of siRNA-resistant WT or mutant PTPA to complement cell growth defect in PTPA-knockdown cells (bottom). Top panel shows expression levels of recombinant and endogenous PTPA. For panels B-G, results represent three separate experiments. For panels C-E, assays were performed in triplicate.

