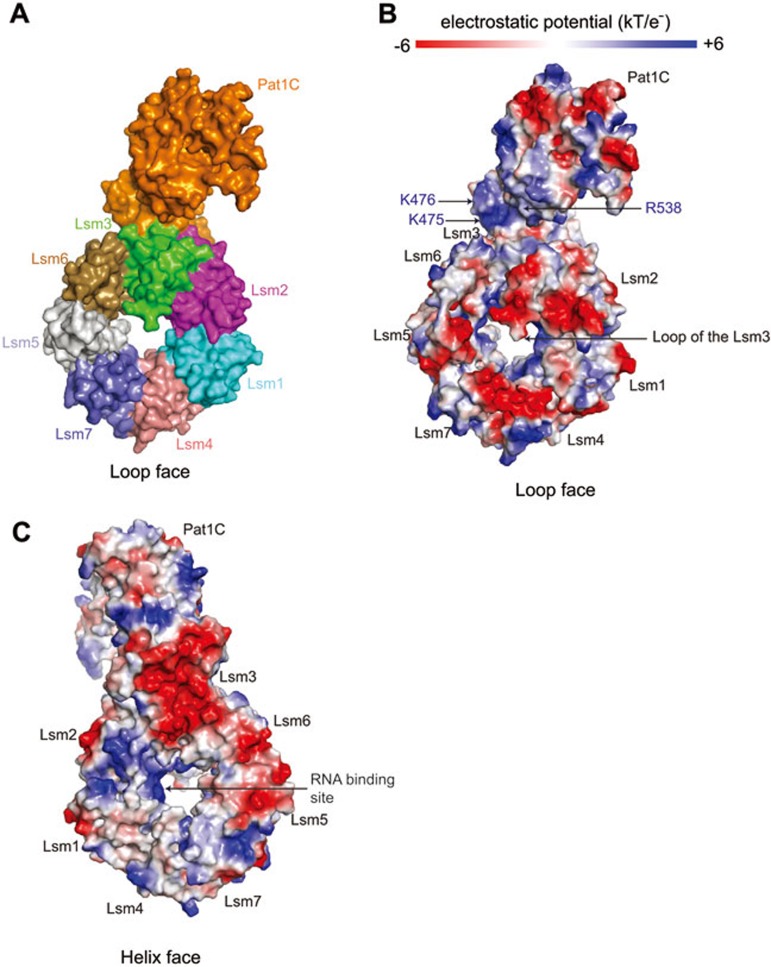
Figure 6.
A model of the Lsm1-7-Pat1C complex. (A) Surface representation of the modeled Lsm1-7-Pat1C complex showing the loop face. (B) Electrostatic potential showing the loop face of the Lsm1-7-Pat1C model. (C) Electrostatic potential showing the helix face of the Lsm1-7-Pat1C model. The view in B is as in A and the complex in C is rotated 180 ° along a vertical axis relative to the view in B.

