
Figure 2.
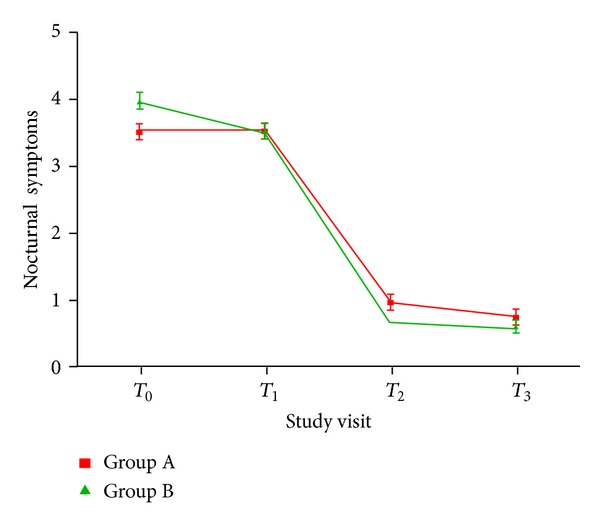
Changes in nocturnal symptoms observed in Groups A and B in the four study visits. The results indicated that patients in Group B had significantly lower nocturnal symptoms scores compared with Group A subjects at both T 2 and T 3 visits (both P values < 0.05). Interestingly, this effect was evident despite the higher baseline (T 0) nocturnal symptoms scores in Group B patients.