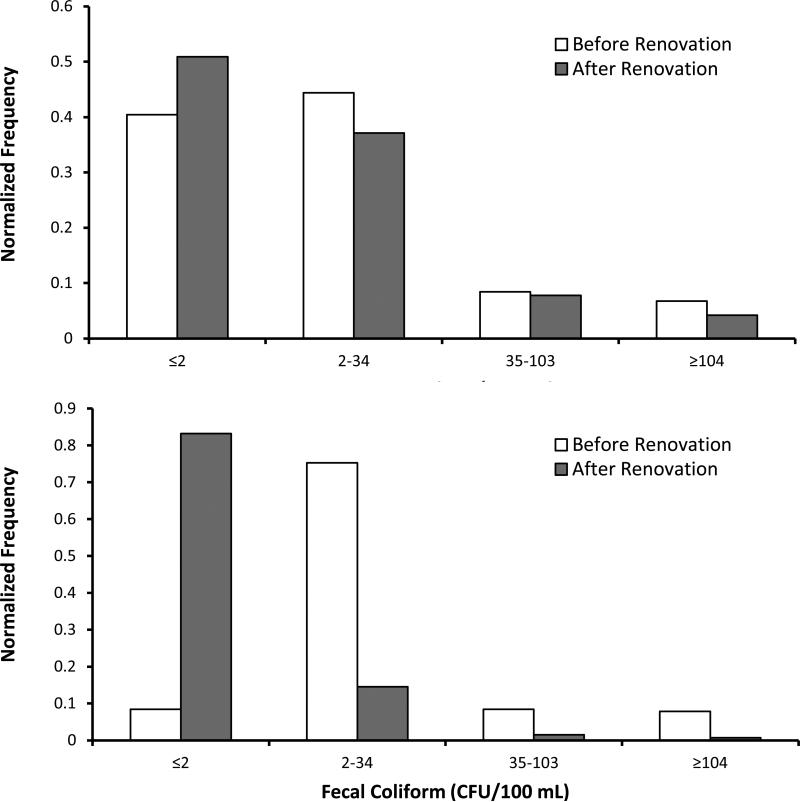
Figure 8.
Histograms demonstrating the distribution of enterococci and fecal coliform in the water at regulatory threshold values before and after renovation. The bin range in CFU/100 mL is shown on the x-axis, while the normalized frequency of that level is shown on the y-axis. Data represents a cumulative of weekly monitoring results 40 months before and 40 months after renovation.

