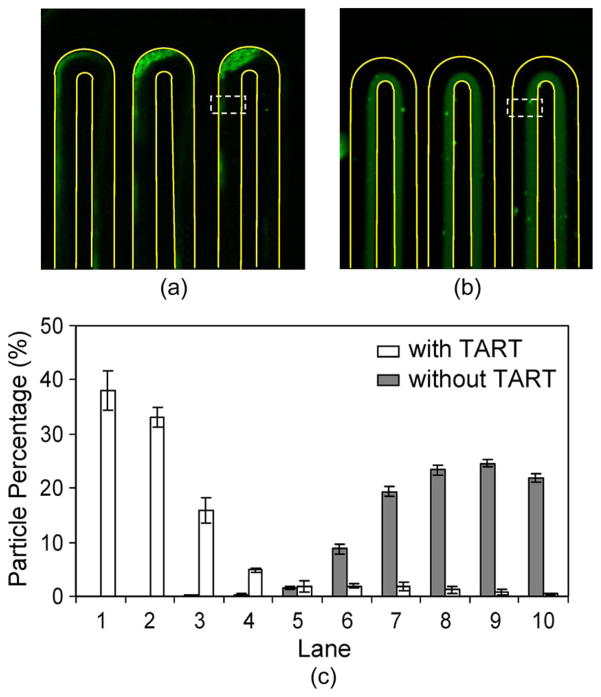
Fig. 4.
Comparison of incubation with and without using the TART scheme. (a) Fluorescent image of target particles with TART enabled. (b) Fluorescent image of target particles with TART disabled. (c) Percentage distributions of target particles across the channel width, in the dashed observation windows immediately preceding the last turn, as shown in the fluorescent images.

