
Figure 4.
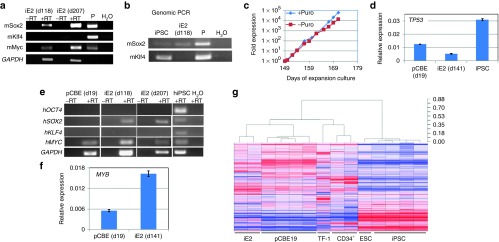
Gene expression studies of iE2 cells. (a) Expression of (mouse) transgenes in iE2 cells after long-term expansion at days (d) 118 and 207 detected by RT-PCR. P: plasmids with the transgene cDNA. (b) Genomic PCR detecting the mouse Sox2 and Klf4 cDNA in genomic DNA. mSox2cDNA is present in iE2 genome (upper panel) but mKlf4 cDNA is absent in iE2 genome (lower panel). iPSC is a human iPSC line derived using pMX-mSox2, mKlf4, mOct4, and mMyc vectors. (c) Puromycin resistance of iE2 cells during expansion suggesting continuous expression of p53shRNA from the integrated retroviral vector. (d) qRT-PCR analysis of human TP53 gene expression of primary day 19 culture-expanded cord blood (CB) erythroblasts (pCBE19), iE2 and iPSC cells. (e) iE2 cells upregulate endogenous human SOX2 gene expression and maintain c-MYC gene expression at both days 118 and 207 of expansion culture. (f) qRT-PCR analysis of human MYB gene expression of primary day 19 culture-expanded CB erythroblasts (pCBE19) and iE2 cells. (g) Dendrogram and heatmap of unsupervised hierarchical clustering analysis of global gene expression profiles of various cell types. Distance numbers on the top right represent the value of Pearson distance (1-R) determined by Pearson correlation algorithms. iE2 cells are clustering with pCBE19 cells while TF-1 cells are clustering with CD34+ HSPCs. ESC/iPSCs are clustering together and separated from all blood cells.