Figure 5.
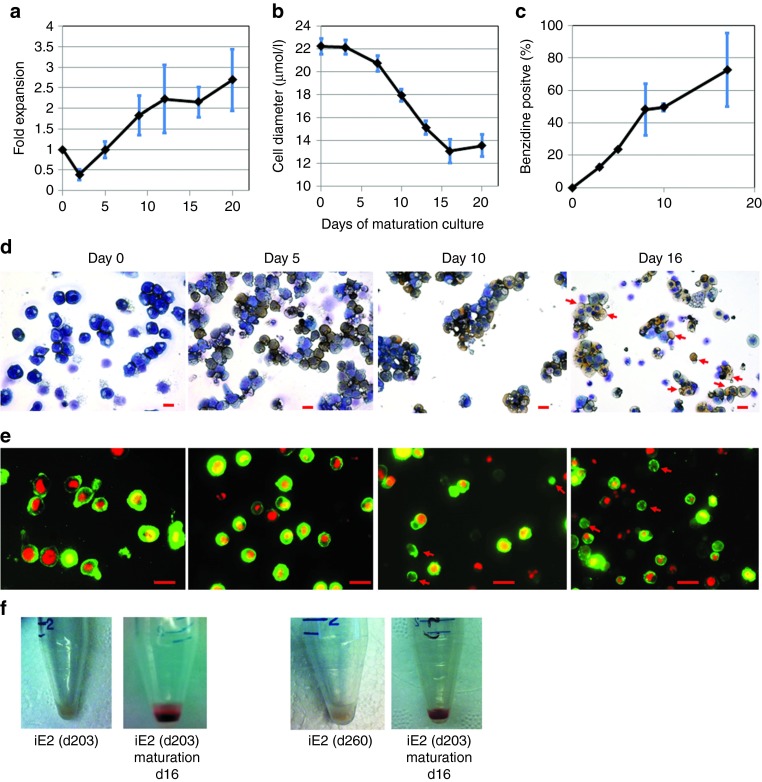
Terminal differentiation potential of iE2 cells. (a) Cell number kinetics of iE2 cells in differentiation culture. (b) Cell diameter kinetics of iE2 cells in differentiation culture. Cell diameters are measured using imageJ software from cytospin images of differentiation culture at different time points. (c) Benzidine positive cells percentage during differentiation culture. Benzidine positive cells are identified and counted in the cytospin images of differentiation culture stained with Benzidine (yellow) and Giemsa (dark blue) (as shown in Figure 5d); at least 100 were counted for each sample. (d) Bright field images of Wright-Giemsa staining and benzidine staining of cytospin slides prepared from iE2 cell differentiation culture at different time points. Red arrows mark representative enucleated erythrocytes found at day (d) 16 of maturation. Scale bar: 20 µm. (e) Multichannel immunofluorescence microscopy images of iE2 cell differentiation culture at different time points. Red: DRAQ5. Green: CD235a-FITC. Red arrows mark enucleated erythrocytes. Red arrows mark representative enucleated erythrocytes. Scale bar: 20 µm. Fluorescence images were taken using Nikon Eclipse TE2000-U inverted microscope with 40×ELWD Plan Fluor/0.6 objective at 25 °C and a Qimaging Micropublisher 5.0 digital camera with QCapture software (Version 3.1.2). (f) Cell pellets of iE2 cells before and 16 days after differentiation culture. Shown data are representatives of five independent experiments.

