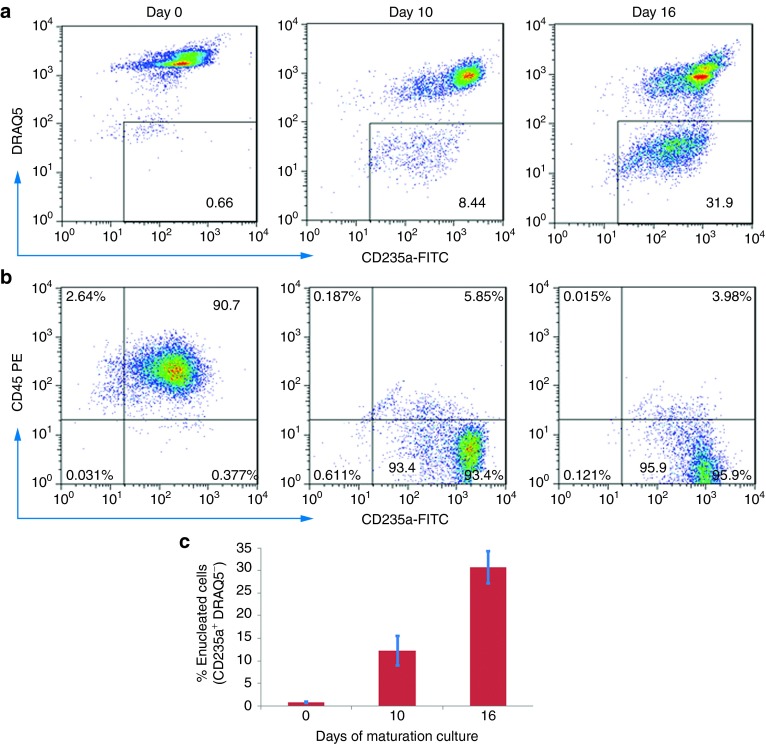
Figure 6.
Flow cytometry analysis of intact cells after terminal differentiation from iE2 cells. (a) Flow cytometry analysis of CD235a (Glycophorin A), DRAQ5 (a cell permeable fluorescent dye after binding DNA) (b) Flow cytometry analysis of CD235a (Glycophorin A) and CD45 cell surface staining during differentiation culture. (c) Percentages of enucleated erythrocytes (CD235a+DRAQ5−) quantified by flow cytometry of 4 independent experiments (n = 4), error bars represent standard error (SE).

