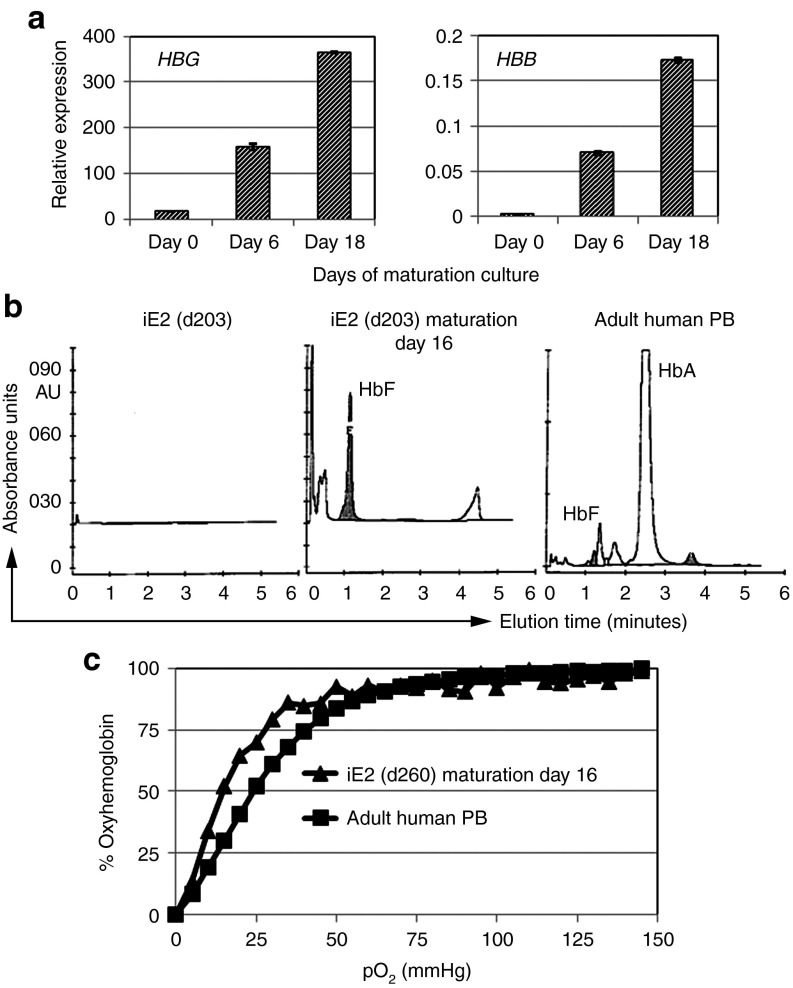
Figure 7.
Functional hemoglobin characterization of iE2 terminal differentiation cells. (a) qRT-PCR of HBG and HBB gene expression during iE2 differentiation culture. (b) Cation-exchange high-performance liquid chromatography analysis for hemoglobin tetramers composition of iE2 cells before differentiation (day 0) (left), day 16 differentiation culture of iE2 cells (middle) and a healthy adult peripheral blood (PB) control (right). (c) Oxygen equilibrium curves of day 16 differentiation culture cells of iE2 cells (triangle) or a healthy adult PB control (square) measured by a Hemox-Analyzer.

