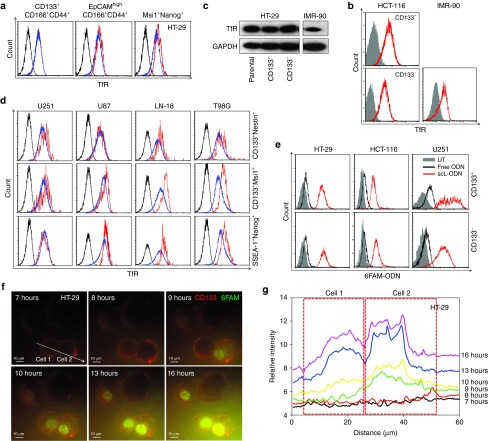
Figure 1.
Overexpression of transferrin receptor (TfR) in solid tumor cancer stem-like cells (CSCs) and their in vitro targeting by the scL nanocomplex. (a) Expression of TfR was assessed in CSCs of human colorectal cancer cell line HT-29 using multiple stem cell markers (CD133+CD166+CD44+, EpCAMhighCD166+CD44+, or Msi+Nanog+). Black histograms represent isotype control. Red histograms represent marker-positive CSCs. Blue histograms represent unselected cancer cells. (b) TfR expression in CD133+ and CD133− populations in another human colorectal cancer cell line (HCT-116) was compared with TfR expression in a noncancerous human lung fibroblast cell line (IMR-90). Closed gray histograms represent isotype control. (c) Expression of TfR in CD133+ and CD133− populations of HT-29 and IMR-90 was assessed by western blot. (d) Expression of TfR was tested in CSCs of human brain cancer cell lines (U251, U87, LN-18, and T98G) using multiple stem cell markers (CD133+CD166+CD44+, EpCAMhighCD166+CD44+, or Msi+Nanog+). Black histograms represent isotype control. Red histograms represent marker positive CSCs. Blue histograms represent unselected cancer cells. (e) Uptake of fluorescently labeled ODN in CD133+ and CD133− populations 24 hours after transfection of HT-29, HCT-116, and U251 cells with uncomplexed free (black histogram) and scL-complexed (red histogram) 6FAM-ODN. Gray histograms represent untreated control. (f) Time lapse images of subcellular localization of 6FAM-ODN in HT-29 cells after scL-mediated transfection using total internal reflection fluorescence (TIRF) microscopy. HT-29 cells were prelabeled with anti-CD133 antibody (red fluorescence) in culture and transfected with scL-6FAM-ODN (green fluorescence) at 0 hour. Images were obtained over a 17-hour period. Scale bars indicate 10 μm. (g) Fluorescence intensity in the CD133+ HT-29 cells were measured in cell 1 and cell 2 along the scanning line denoted by the arrow in f. Change in fluorescence intensity over time is shown at 7, 8, 9, 10, 13, and 16 hours after transfection. The dotted boxes indicate each cell.

