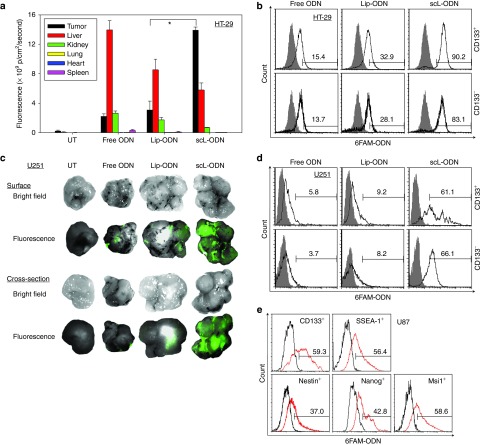
Figure 4.
Tumor specificity and cancer stem-like cell (CSC)–targeting ability of the scL nanocomplex in vivo after systemic administration. (a) Quantitative analysis of the intensity of green fluorescence signal, representing uptake of 6FAM-ODN, in HT-29 subcutaneous tumors and normal tissues using the Maestro in vivo fluorescence imaging system. Signal intensity is expressed as photons/cm2/second. (b) Flow-activated cell sorting (FACS) analysis of 6FAM-ODN uptake in CD133+ CSCs and CD133− non-CSCs isolated from the HT-29 tumors after imaging. (c) Ex vivo fluorescence imaging of U251 subcutaneous tumors after a single i.v. injection with 100 µg of 6FAM-ODN/mouse. (d) FACS analysis of 6FAM-ODN uptake in CD133+ CSCs and CD133− non-CSCs isolated from U251 tumors. Analysis was performed 24 hours after injection. In b and d, the values listed above the bar in each histogram indicate the percentage of the cells positive for 6FAM-ODN. Gray histograms represent untreated control. (e) FACS analysis of 6FAM-ODN uptake in stem cell markers (CD133, SSEA-1, Nestin, Nanog, and Msi1)-positive populations isolated from U87 intracranial tumor xenografts 24 hours after a single i.v. injection with 100 µg of 6FAM-ODN/mouse administered as scL-6FAM-ODN. Black histograms represent untreated control. The values listed above the bar in each histogram indicate the percentage of the cells positive for 6FAM-ODN. Statistical significance was determined using analysis of variance (*P < 0.05).

