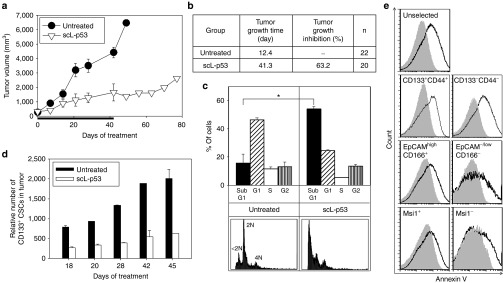
Figure 8.

Efficient tumor growth inhibition and induction of apoptosis in cancer stem-like cells (CSCs)/non-CSCs in colorectal xenografts. (a) Changes in tumor sizes with treatments. Mice were treated i.v. with scL-p53 (30 µg DNA/mouse/injection) twice per week for 6 weeks and tumor sizes were monitored weekly. Tumor sizes were plotted versus the number of days after initiation of the treatment. Black bar indicates the duration of treatment. (b) Summary of tumor growth. Tumor growth time: time in days required to reach a fivefold increase in tumor volume from the size at the start of treatment. Tumor growth inhibition: calculated as the ratio of tumor volume between scL-p53 treated tumors and untreated control tumors after completing treatment (6 weeks). (c) Cell cycle analysis of tumor cells after treatment. Sub-G1 peaks (<2N) represent apoptotic cells. Apoptotic response was determined by quantifying the sub-G1 population. Representative histograms are shown. (d) Changes of the relative numbers of CD133+ CSCs in tumors. The relative number of CSCs was calculated from tumor size in a and percentage of CD133+ CSCs by flow-activated cell sorting (FACS) analysis. (e) Apoptosis in CSCs after treatment in a second in vivo experiment. The ratio of Annexin V positive cells in tumors after treatment was evaluated by FACS analysis. Tumor cells were colabeled with CSC markers (CD133+CD44+, EpCAMhighCD166+, or Msi1+) for gating. Representative histograms are shown. Gray solid histogram: untreated cells. Black histogram: scL-p53 treated cells. Statistical significance was determined using analysis of variance (*P < 0.05).
