
Figure 5.
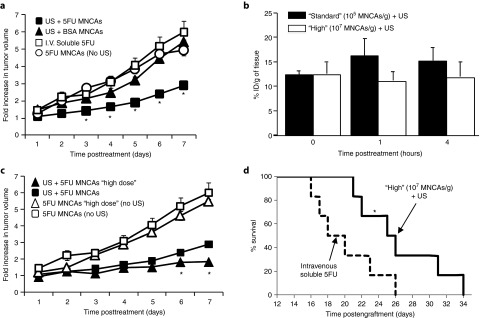
Ultrasound (US) activation of 5FU-Bearing MNCAs inhibits growth of subcutaneous C6 gliomas in vivo. (a) Fold change in tumor growth following US activation of 5FU-bearing MNCAs, US activation of BSA-bearing MNCAs, intravenous (i.v.) infusion of soluble 5FU, or i.v. infusion of 5FU-bearing MNCAs without US activation. *Significantly different than all other groups at same time point (P < 0.05). (b) Bar graph of fluorochrome concentration (% initial dose (ID) per gram of tissue) in tumor as a function of time following MNCA treatment at “high” and “standard” doses. (c) Fold change in tumor growth following US activation of 5FU-bearing MNCAs at “standard” and “high” doses, as well control groups in which 5FU-bearing MNCAs at “standard” and “high” doses were not activated with US. All values are means + SD, but many bars are not visible because they are smaller than the symbol. *Significantly different than all other groups at same time point (P < 0.05). (d) Kaplan–Meier survival curve following “high” dose 5FU-bearing MNCA treatment and i.v. soluble 5FU. *Significantly different at P = 0.041.