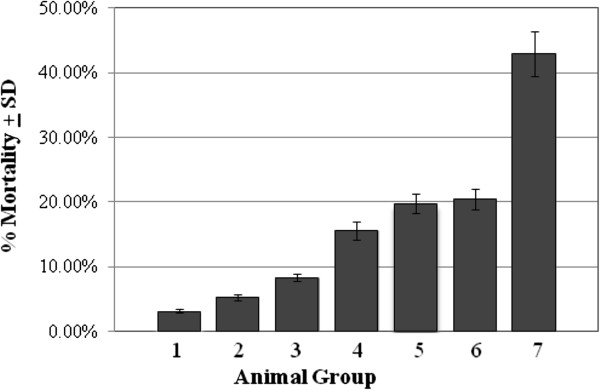
Figure 3.

Mortality rates in control and experimental mouse groups of the study. Data presented here represent the average percentage mortality/group as calculated by dividing the number of dead mice per total number of mice per group as obtained from three separate experiments.
