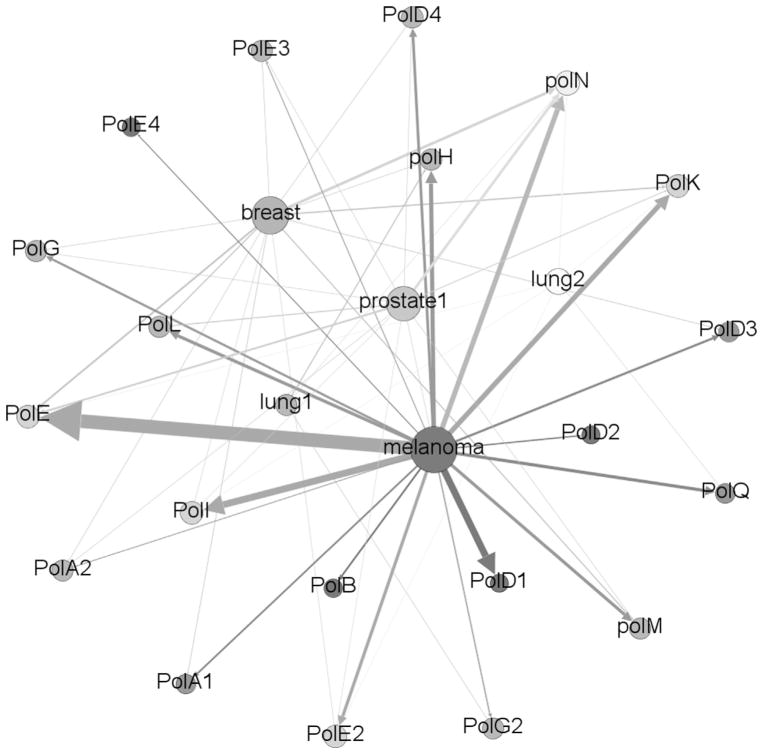
Fig. 2.
Edge-node network of the HyDn-SNPs results. Phenotypes and polymerases are shown as nodes, edges are weighted by total number of SNPs connecting each phenotype to each polymerase. This is also available as an interactive map at http://www.chem.wayne.edu/cisnerosgroup/gexf-js2/index2.html.

