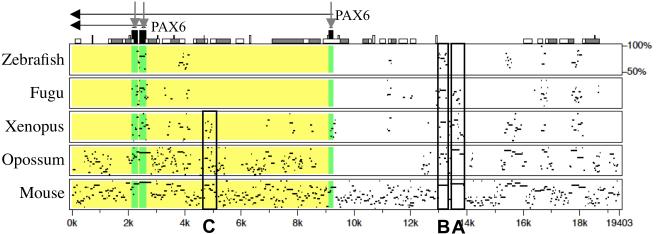
Fig. 2.
A pip view output of MultiPipMaker analysis that was generated with sequences downloaded from the ECR Browser window shown in Figure 1. The alignments between the base sequence (human) and zebrafish, Fugu, Xenopus, opossum, and mouse sequences are shown from the top to the bottom. Above the alignment, the gene name (PAX6) and its transcriptional orientation (horizontal black arrows) are shown. The black boxes on the top of the Pip view (indicated by vertical gray arrows) indicate the exons, and other boxes indicate repeats, transposons and other sequence features in the base sequence (go to PipMaker Instructions for details, http://pipmaker.bx.psu.edu/pipmaker/pip-instr.html). The regions of the zebrafish, Fugu, Xenopus, opossum, and mouse sequences that correspond to exons and introns of the base sequence are also shaded in the alignments with dark gray and light gray, respectively. In addition to the pancreas enhancer (A) and lens/cornea enhancer (B), the C region, which is conserved only in tetrapods, is boxed.

