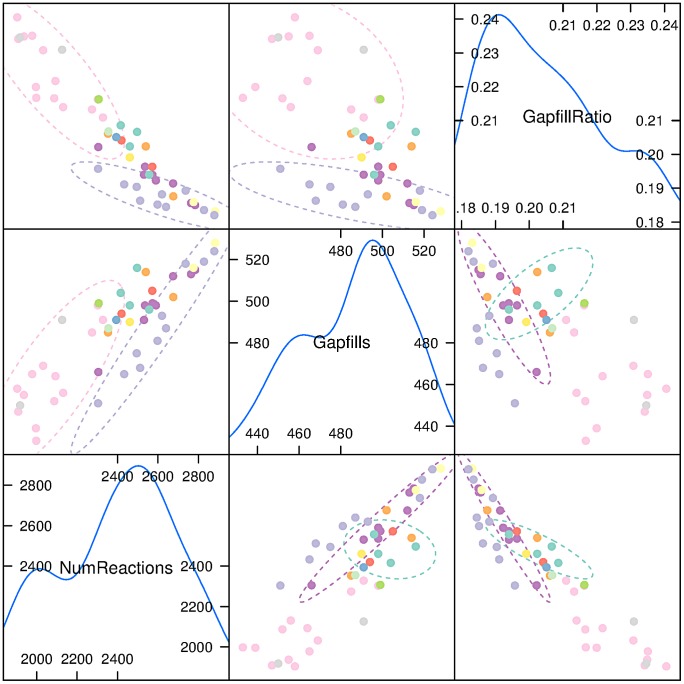
Figure 4. Reconstructed models summarized in terms of number of reactions (NumReactions), number of gapfilling reactions (Gapfills) and fraction of gapfilling reactions to all reactions in the reconstructed model (GapfillRatio).
Density plots shown in diagonals. Species colored according to taxonomic class (see Fig. 2). In top left, pink and blue ellipses denote Saccharomycotina and Eurotiomycetes, respectively. In bottom right, purple and cyan ellipses denote Sordariomycetes and Agaricomycetes, respectively. Data for E. cuniculi not shown.

