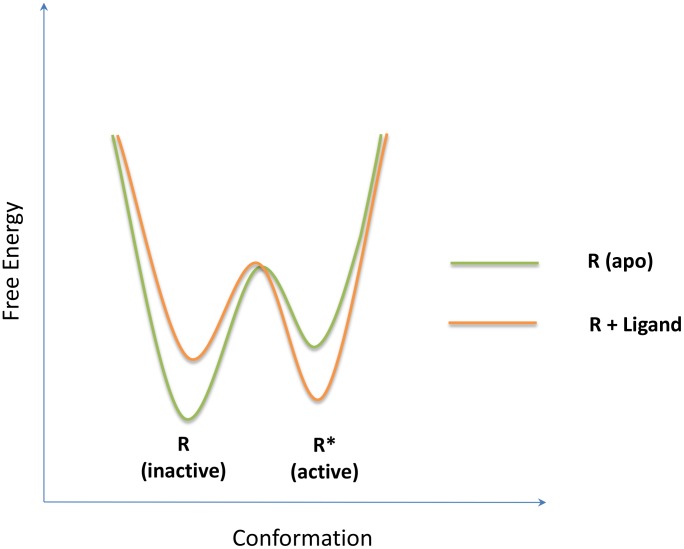
Figure 3. The simplest free energy landscape presentation of the thermodynamic view of allostery.
At the bottom of the folding funnel, an apo protein is optimized to populate two states,  (inactive) and
  (active), with each basin representing an ensemble of conformations and their relative populations as determined by the relative depth of the local basins. Allostery is clearly seen by a population shift from the inactive state dominated by apo (light green) to the active state prevailing in the complex (pale orange) through allosteric ligand binding.

