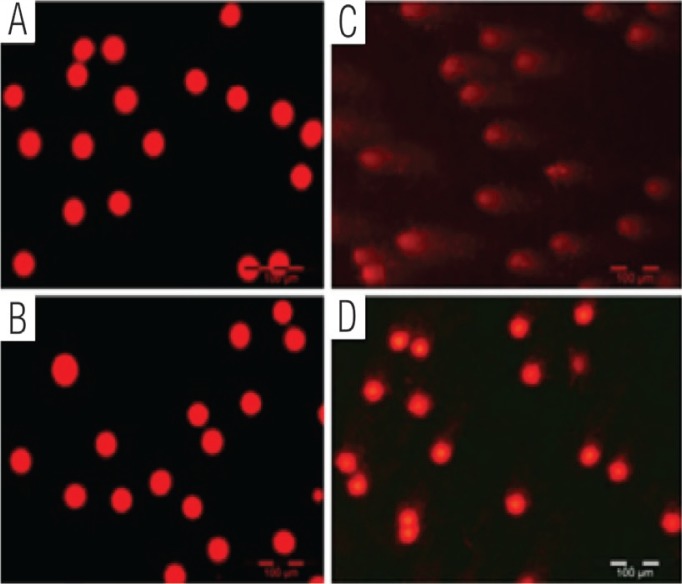
Figure 3:
Single-cell gel electrophoresis assay image of the deoxyribonucleic acid (DNA) using rat whole blood (10 μl) directly for the assay. Single-cell gel electrophoresis image of the DNA in the (A) normal group; (B) normal with tocotrienol-rich fraction (TRF) group; (C) diabetic group, and (D) diabetic with TRF group.

