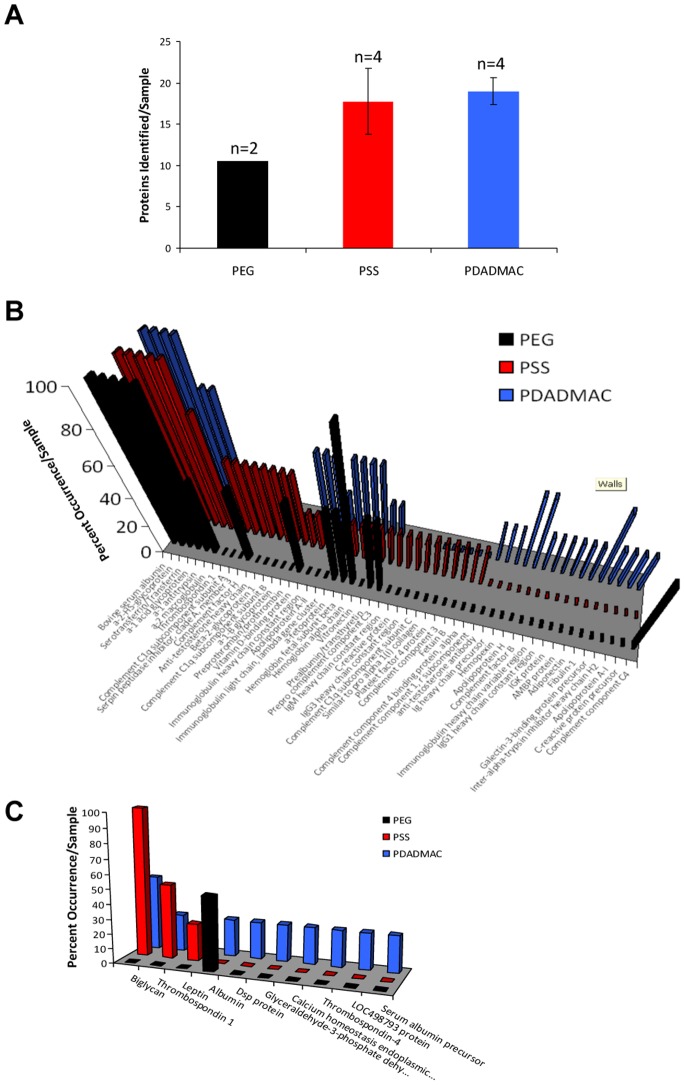
Figure 5. Identification of Proteins Extracted from PEG-, PSS-, and PDADMAC-coated Gold Nanorods.
(A) Total number of proteins detected from each nanorods preparation. Data are mean +/− SEM. (B) Frequency of detection of unique bovine proteins, expressed as a percentage of the total number of samples analyzed, from each nanorods preparation. Data are mean +/− SEM. (C) Frequency of identification of unique rat proteins in each preparation of AuNR expressed as a percentage of the total number of samples analyzed. Data are means of n = 2–4 samples/group.

