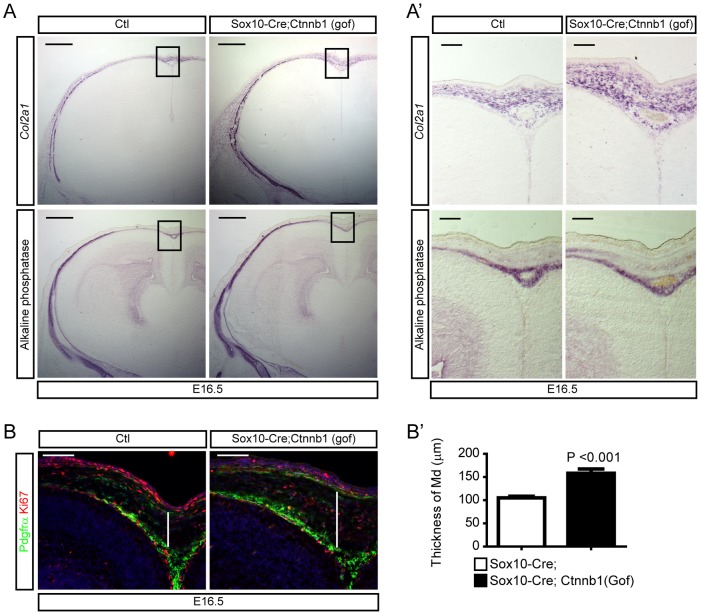
Figure 2. Expansion of mesenchymal cells by activation of β-catenin in neural crest cells.
A) Mesenchymal cells of Sox10-Cre;Ctnnb1(gof) mutant at E16.5 marked by Col2a1 expression (top) and alkaline phosphatase activities (bottom, osteoblasts) obtained from adjacent sections. Higher magnification images of the boxed areas are shown in A′. B) Mesenchymal cells were labeled for Pdgfrα and Ki67 to show the proliferating mesenchymal cells. B′) A graph shows thickness of dermal mesenchymal cells in the midline at E16.5 (white lines of B, n = 3). Error bar indicates SEM. Scale bars = 100 µm.

