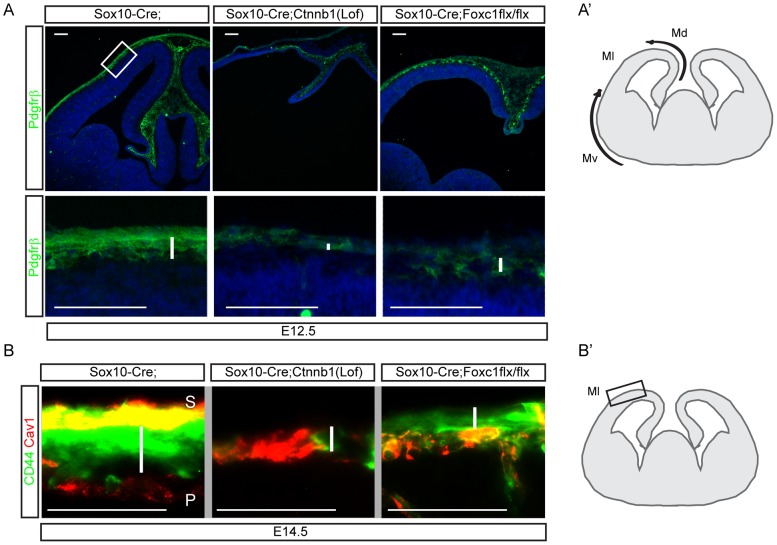
Figure 5. Failure of mesenchymal coverage of the neocortex after loss of ß-catenin signaling in neural crest.
A) Sections of E12.5 embryos were stained for Pdgfrß. Dorsomedial Pdgfrß+ mesenchymal cells are shown in the top panel. Higher magnification images of neocortical mesenchymes are presented in the lower panel (corresponding to the boxed region). White bars indicate the distribution of Pdgfrß+ mesenchymal cells. A′) A schematic drawing shows two sources of migrating neural crest cells to the neocortex. Md = dorsal mesenchyme, Ml = lateral mesenchyme, Mv = ventral mesenchyme. B) Sections from E14.5 embryo heads were stained for CD44 and Cav1 to show MSCs and meningeal blood vessels, respectively. Thickness of the CD44 domain is reduced in both Sox10-Cre;Ctnnb1(lof)flx/flx and Sox10-Cre;Foxc1flx/flx mutants than the control (as marked by white bars). B′) A schematic drawing shows the region where images were taken (Ml). Scale bars = 100 µm.

