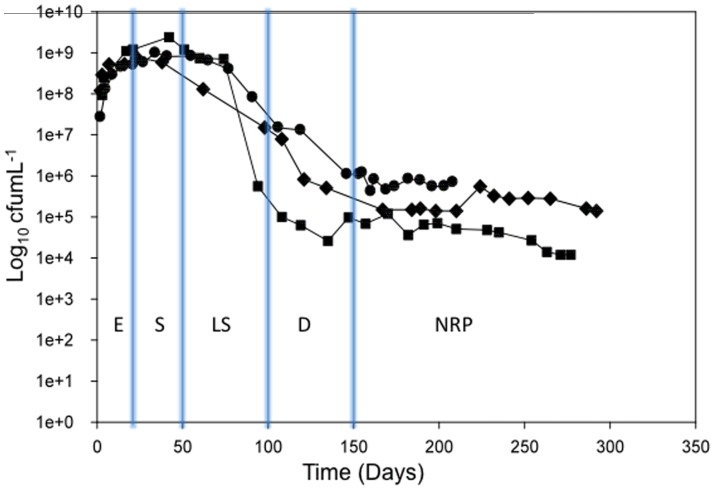
Figure 1. Growth curves for M. tuberculosis grown in medium containing Tween 80 as the primary carbon source.
Total viable counts for Culture 1 (circles), Culture 2 (diamonds), and Culture 3 (squares), were measured over an extended period of at least 200 days. An estimation of each growth phase is indicated on the graph: exponential phase (E), stationary phase (S), late stationary phase (LS), death phase (D), and non-replicating persistent phase (NRP).

