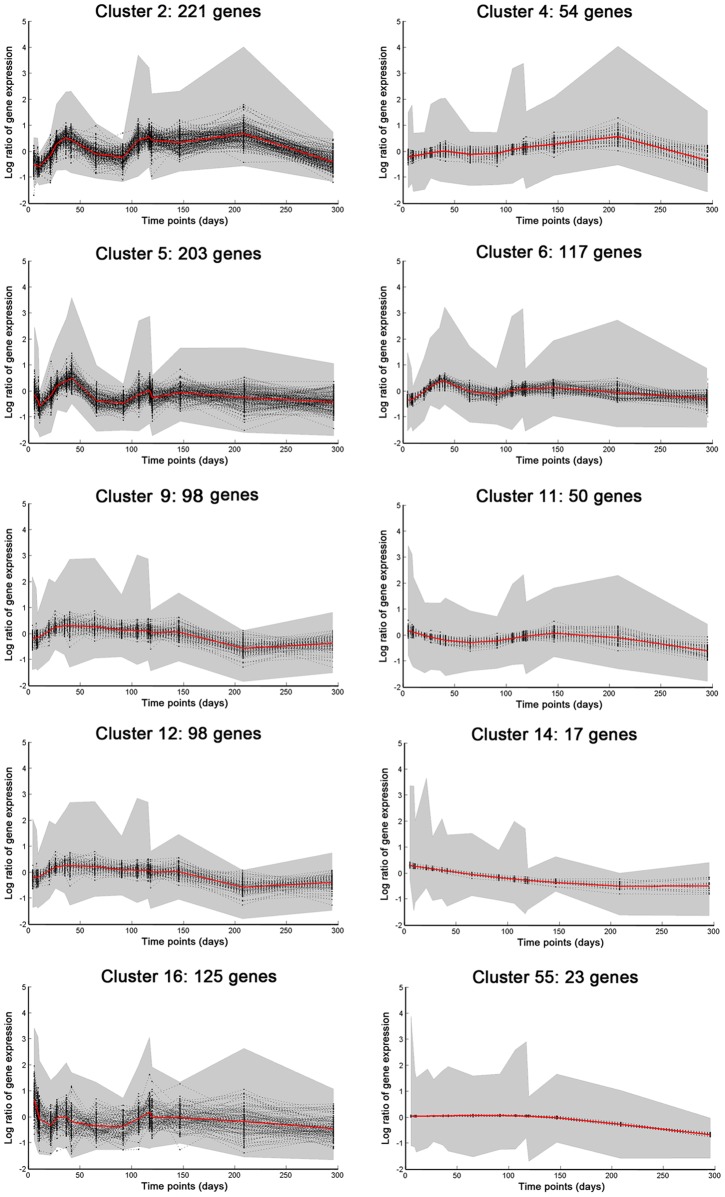
Figure 7. Gene expression clusters with a marked enrichment in fatty acid metabolism, lipid degradation, and cell wall re-modeling.
Graphs show normalised log expression values (centered around a mean value of zero) over the time-courses in Cultures 1 and 2. The shaded area represents the 99% confidence interval for the curves.

