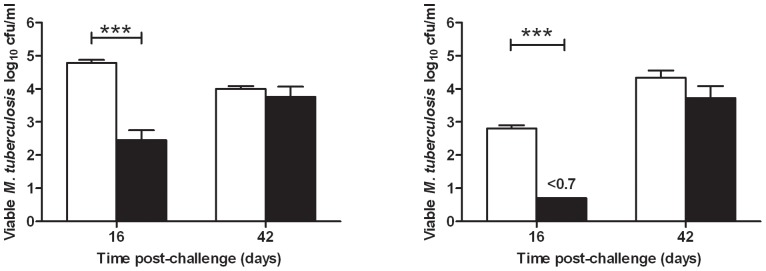
Figure 9. Bacterial load at day 16 and day 42 in guinea pigs post aerosol challenge with either log phase culture or NRP culture.

Lungs in Panel A) and spleen in Panel B), challenged with either exponentially growing culture (white) or NRP culture of M. tuberculosis (black). Bars indicate group mean log10 cfu mL−1 +/− S.E.M of 8 guinea pigs. Statistical analysis was performed using paired T-tests. *** indicates P = <0.001.
