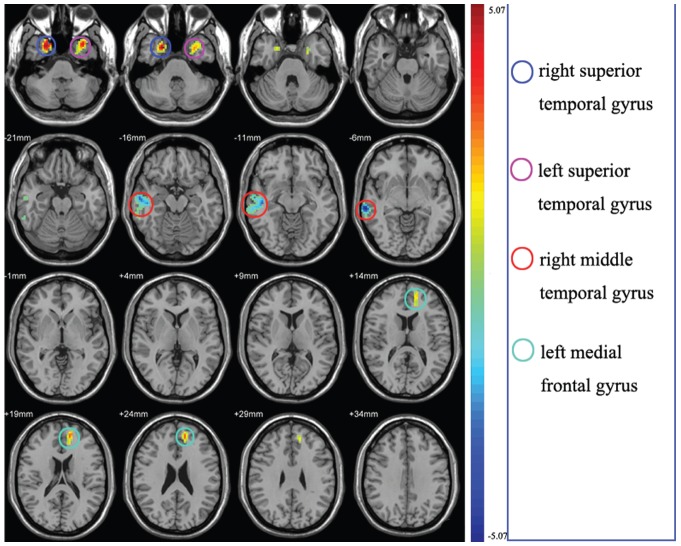
Figure 2. Maps showing statistically significant differences between the ESRD group and the control group.
The Patients with ESRD showed a significant ReHo increase in the bilateral superior temporal gyrus and left medial frontal gyrus (warm colors), but a decrease in the right middle temporal gyrus (cold colors) (n = 20, corrected P<0.05).

