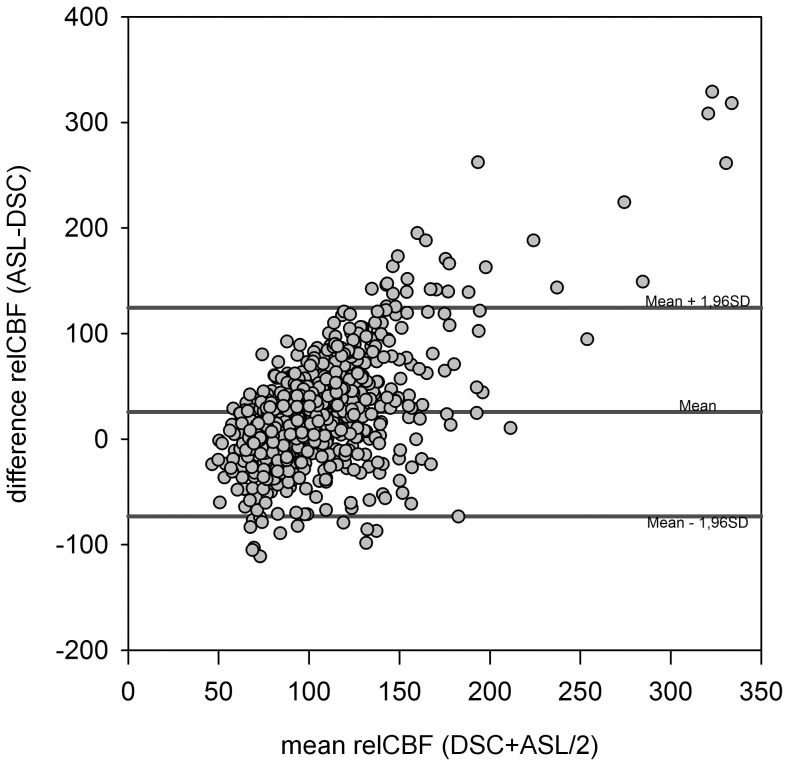
Figure 4. Bland-Altman-Plots comparing DSC-CBF and ASL-CBF.
In the Bland Altman Plot, there is a large positive difference around 144% for high mean relCBF values between the two modalities. For low mean relCBF values, on the other hand, a large negative difference around −113% is seen. This pattern is suggestive of a proportional error. However, this was not confirmed by a logarithmic Bland-Altman Plot (not shown).

