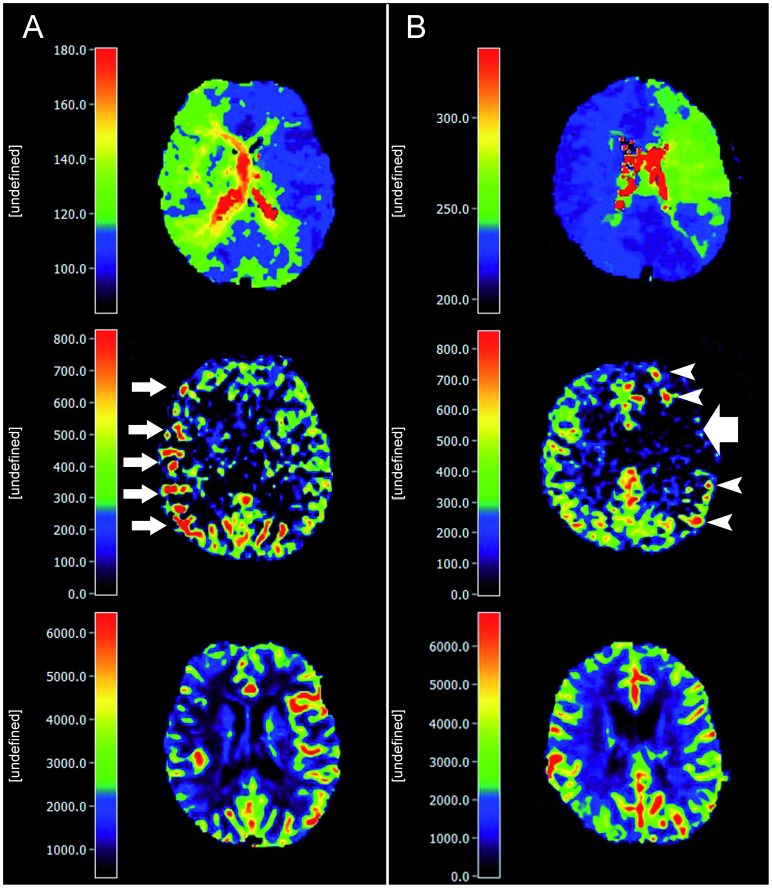
Figure 6. Exemplary patients showing blood arrival delay effects in ASL imaging.
A) 66-year-old female, occlusion of the right ICA. The TTP image shows a visible ipsilateral delay (relTTP = 0.8 sec). In the ASL image, hyperintense arterial transit delay artifacts are seen (small white arrows). On the reference DSC-CBF map, a hypoperfusion in the affected hemisphere is present. B) 45-year-old female, occlusion of the left middle cerebral artery. In the ASL image, a hypointensity is seen in the area affected by delay (large white arrow, relTTP = 1.5 sec). In contrast, no apparent changes are present in the DSC-CBF map. In patient A, a moderate blood transit delay leads to the presence of hyperintense ADTA. The more severe delay in patient B might explain the hypointense ADTA surrounded by hyperintense areas in its borderzone as a sign of collateral macrovessels. All slices are coregistered. The scales do not represent absolute values.

