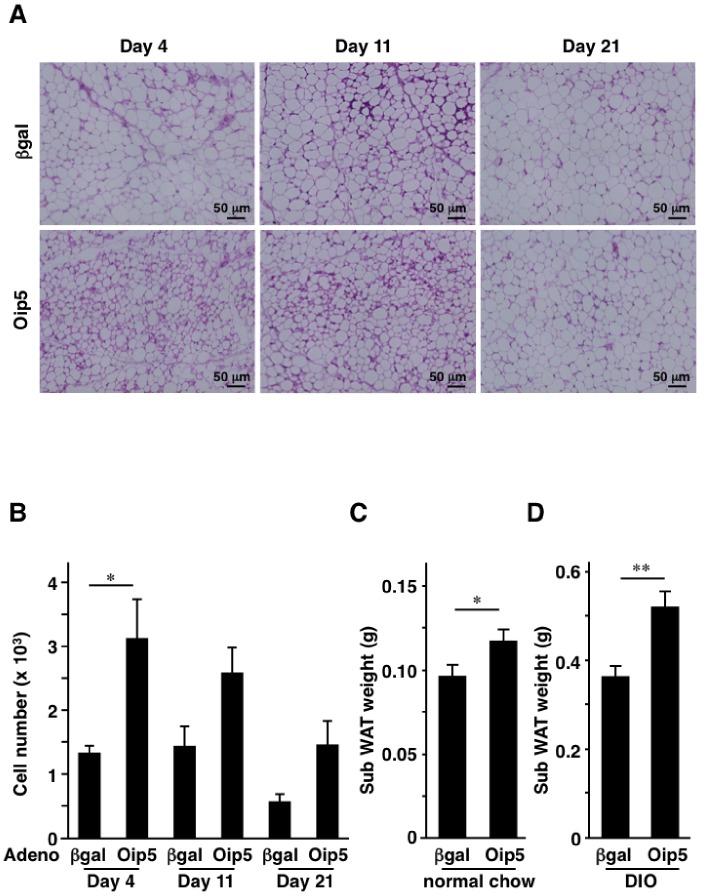
Figure 5. Local adenovirus-mediated gene transfer of Oip5 to in vivo adipose tissues.
C57BL/6N mice were injected with 25 µL (2.5×10⁹ pfu/mL) of adenovirus expressing β-galactosidase (βgal) or Oip5 into subcutaneous fat. Mice were analyzed at day 4, 11, and 21 after adenovirus administration. A, Representative hematoxylin and eosin (H&E)-staining section of fat tissues at 4, 11, and 21 days after adenovirus injection. B, Number of cells after adenovirus administration. The number of nucleus was calculated by using BZ analyzer in Hybrid Cell Count mode. C, Subcutaneous fat weights at day 11 after adenovirus administration. Mice were fed with normal chow and were administered with adenovirus at 8 weeks of age. D, Adenovirus-administered subcutaneous fat weights of diet-induced obesity (DIO). C57BL/6N mice were fed with high-fat/high-sucrose (HF/HS) diet from 6 weeks of age and were administered with adenovirus at 8 weeks of age. Mice were analyzed at 13 weeks of age. Oip5, Opa-interacting protein 5; βgal, β-galactosidase. Adeno, adenovirus. Sub WAT, subcutaneous white adipose tissues. Values are mean ± SE; n = 3 (in B), and n = 9–10 (in C and D) for each group. *P<0.05;**P<0.01.

