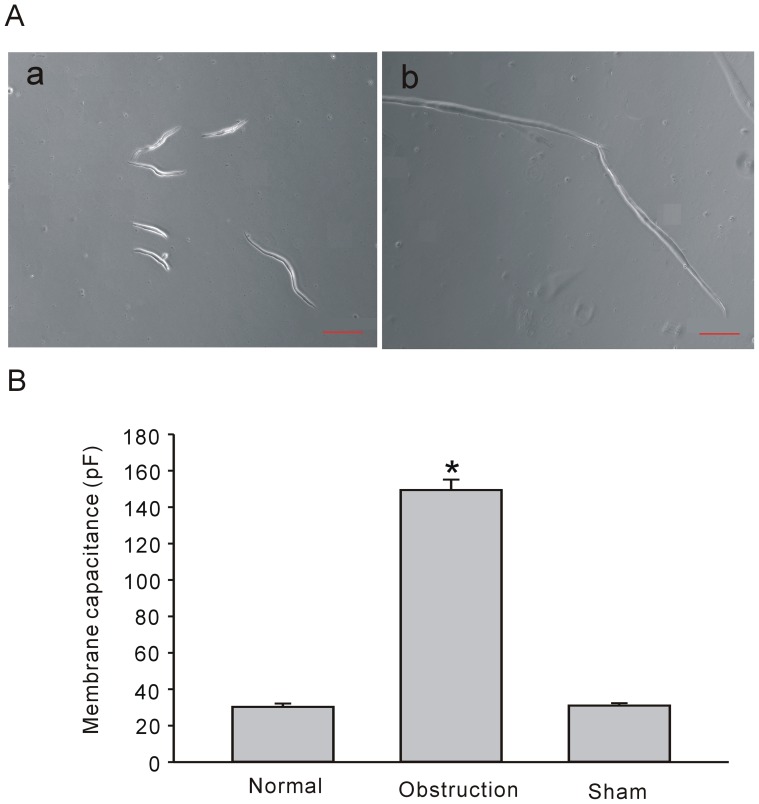
Figure 1. The hypertrophy of smooth muscle cells induced by partial intestinal obstruction.
A shows normal (a) and hypertrophic smooth muscle cells (b), the cell size was significantly enlarged in obstruction group. B shows the mean values of cell capacitances among normal, sham and obstruction groups. Data showed the means ± SE *P<0.01 versus sham and normal groups, *P<0.05 versus normal and sham group, Bar = 100 µm.

