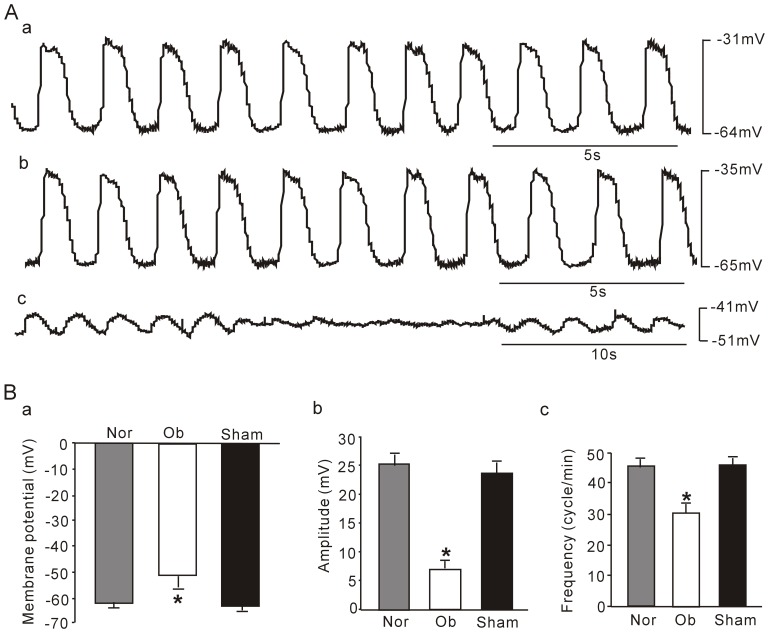
Figure 2. Changes of slow wave and resting membrane potential (RMP) in hypertrophic smooth muscles.
Electrical slow waves were recorded from small intestinal muscle stripes of normal group (Aa), sham group (Ab), and obstruction group (Ac). The RMP (Ba), amplitudes (Bb) and frequencies (Bc) of slow wave were significantly changed in normal, sham and obstruction groups. Data showed the means ± SE *P<0.01 versus sham and normal groups.

