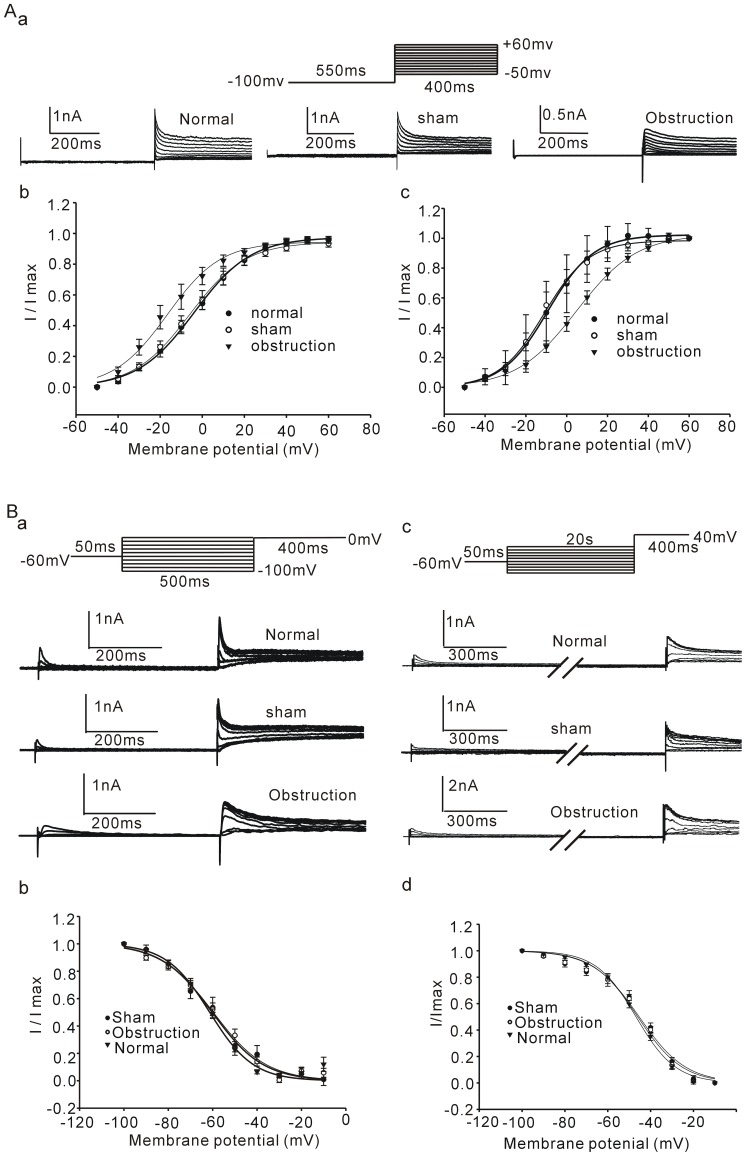
Figure 4. Comparisons of voltage-dependent activation and inactivation of IKV in normal, sham and obstruction groups.
Aa shows representative raw traces were elicited by a series of voltage champs from a holding potential of −60 mv to selected test potentials ranging from −50 to +60 mV for 400 ms. Interval between each pulse is 10 s. Voltage-dependent activation of IKVpeak (Ab) and IKVsustained (Ac) were respectively converted into conductivity using the Goldman-Hodgkin-Katz current equation. The conductivies were the normalized and plotted as a function of test potential and fitted with a Boltzmann function. Ba shows representative current traces of IKV were elicited by a series of the conditioning potential ranging from −100 to 0 mV for 500 ms following a 0 mV test potential for 400 ms. Bc shows current traces of IKV were elicited by a series of the conditioning potential ranging from −100 to 0 mV for 20 s following 40 mV test potential to adequately activate the IKVsustained. Interval between each pulse is 10 s (Ba c). Voltage-dependent inactivation curves of IKVpeak (Bb) and IKVsustained (Bd) were plotted as a function of the conditioning potential and fitted with a Boltzmann function. Data showed the means ± SE(Ab c, Bb c).

