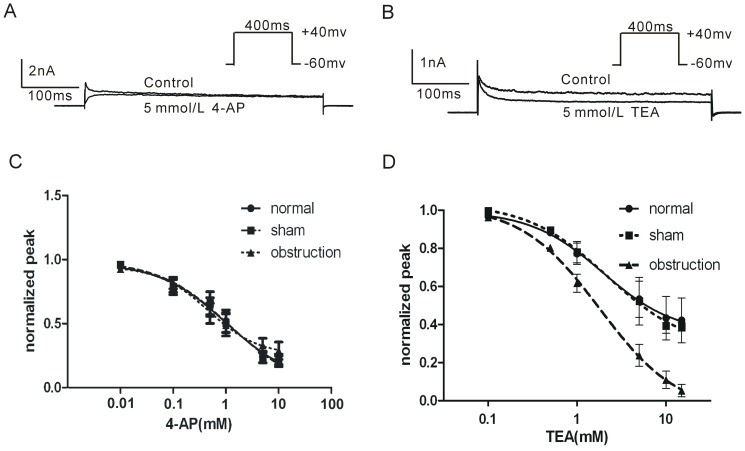
Figure 5. Comparison of the sensitivities of IKV to 4-AP and TEA in normal, sham and obstruction groups.
Membrane currents elicited by 400−60 mV to +40 mV in control or in 4-AP 5 mM (A) or TEA 5 mM (B). Interval between each pulse is 10 s. Average dose-response curves of 4-AP (C) and TEA (D) where each point was the averaged Itest/Icontrol and error bars were means ± SE. IC50 values were obtained through the software GraphPad Prism 5.

