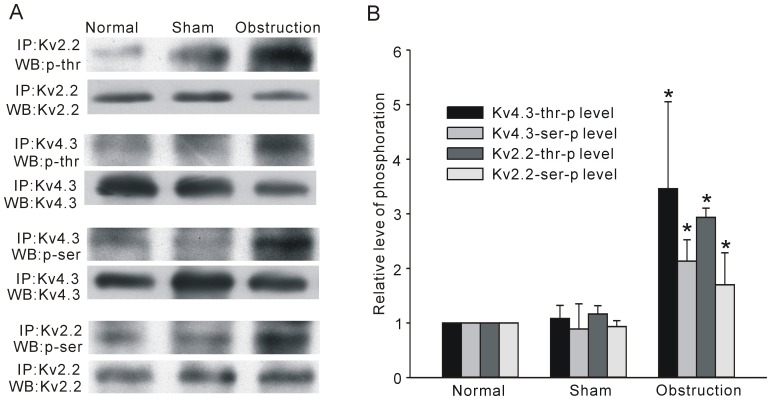
Figure 9. Phosphorylation levels of KV4.3 and KV2.2 in normal, sham, and obstruction groups.
Phosphorylation of Kv4.3 and Kv2.2 were examined by immunoprecipitation (IP) with ant-Kv4.3 antibody followed by IB with antibody against p-threonine, p-serine and Kv4.3 or IP with anti- Kv2.2 antibody followed by IB with antibody against p-threonine, p-serine and Kv2.2 (A). Corresponding bands were scanned and the phosphorylation band optical density was normalized by the total protein density. Data were the means ± SD and were expressed as folds versus normal. *P<0.05 versus normal and sham, n = 5 (B).

