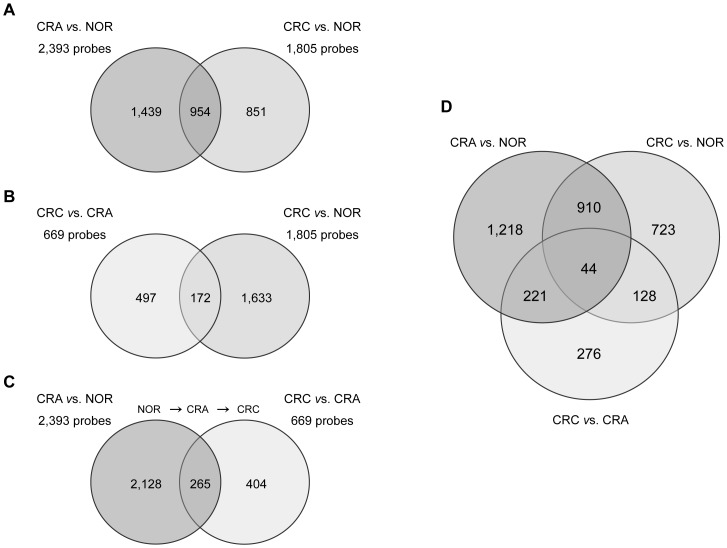
Figure 2. Venn diagrams of probe level alterations in colorectal lesions.
An intersectional analysis of probe level alterations was performed. Cut-off values were P-value ≤0.01 and fold-change ≥2. The CRA vs. NOR comparison showed the largest number of probe level changes (2,393 deregulated probes), while the CRC vs. CRA comparison showed the lowest (669 deregulated probes). The probes that showed alterations in two or in the three comparisons were of interest. (A) Signature of 954 probes deregulated in both CRA and CRC lesions as compared to NOR. (B) Signature of 172 probes deregulated in CRC in comparison to both CRA and NOR. (C) Signature of 265 probes deregulated in CRC as compared to CRA, which levels were already abnormal in CRA as compared to NOR. (D) Signature of 44 probes showing alterations in the three comparisons (CRA vs. NOR, CRC vs. CRA and CRC vs. NOR). Abbreviations: NOR: colorectal normal mucosa; CRA: colorectal adenoma; CRC: colorectal cancer.

