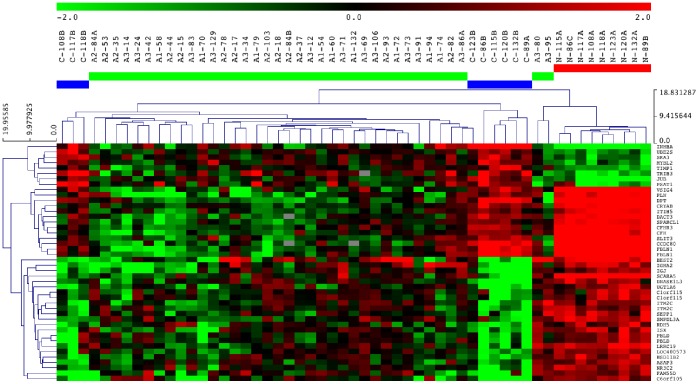
Figure 3. Hierarchical clustering (Euclidean, average linkage) considering the expression signature of 44 probes.
Branches represent individual colorectal samples. Different colors were used to identify the sample groups: red, group of normal mucosae (N: normal); green, group of adenomas (A: adenoma); blue, group of adenocarcinomas (C: cancer). The first sample annotation corresponds to the sample group. The subgroups of adenomas are specified: A1, adenomas with areas of micro-invasive adenocarcinomas; A2, adenomas with areas of intra-mucosa adenocarcinomas; A3, adenomas with areas of dysplasia. The second sample annotation corresponds to the sample number.

