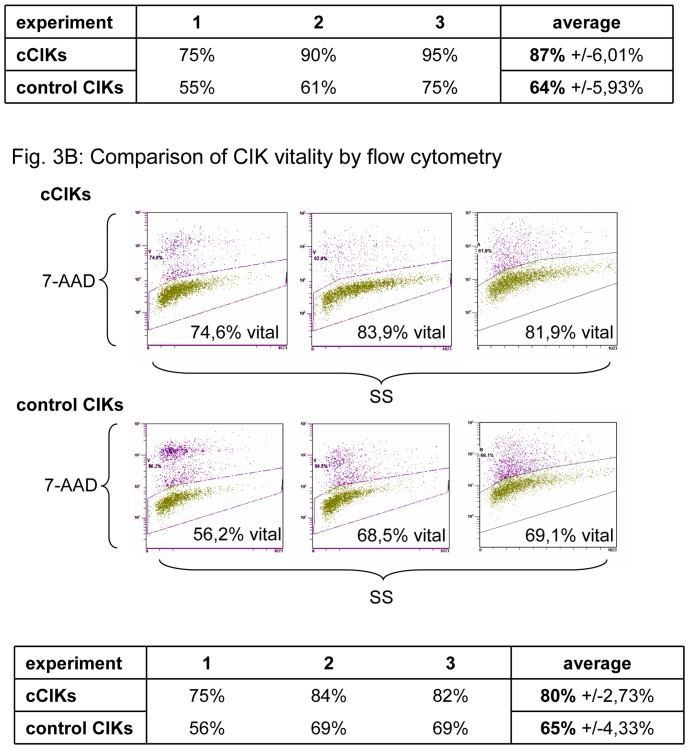
Figure 3. Comparison of CIK vitality.
Vitalities of control CIKs and cCIKs were assessed on day 14 using two different methods. Part A displays vitalities determined using trypan blue staining. No significant differences in CIK viability were found at the 0.05 level (p = 0.1). Part B shows comparisons of CIK vitality, as assessed using 7-AAD staining. No significant differences were found (p = 0.1).

