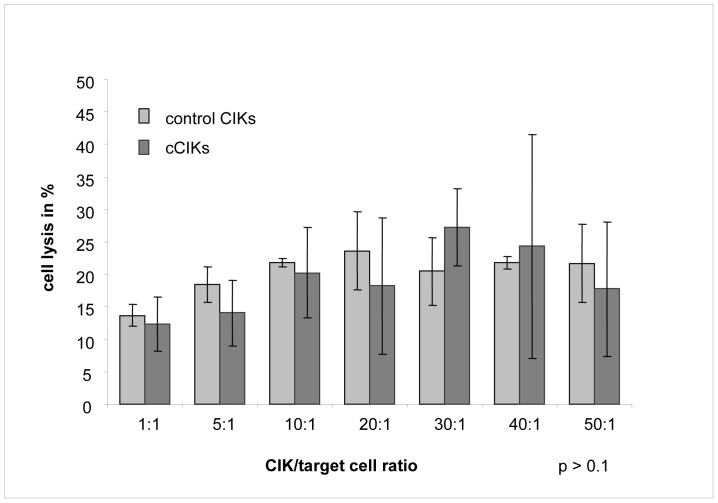
Figure 4. Comparison of CIK lysis potential against tumour cells.
Lysis rates of control CIKs compared with those of cCIKs against fibrosarcoma cells (Wehi 164 S) on day 14 for different effector-cell/target-cell ratios. Error indicator represents standard error of the mean. Initially, lysis rates increased with increasing effector-cell/target-cell ratio up to a lysis rate of 27% at a ratio of approximately 30∶1. Further increases in the ratios did not increase lysis rates further. No significant differences were observed between control CIKs and cCIKs (p>0.1).

