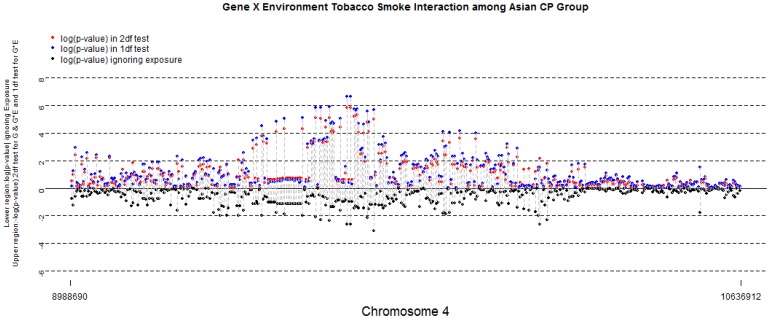
Figure 2. Gene × Environmental Tobacco Smoke Interaction among Asian CP Group.
Double Manhattan plots for SNP effects ignoring maternal exposures (black dots in the lower half) and considering G and GxE interaction for environmental tobacco smoke on selected region on chromosome 4p among 259 Asian trios. Blue dots represent -log10(P) from the 1 df test of GxE interaction alone; red dots represent -log10 (P) from the 2 df test of G and GxE interaction. Dashed lines connect SNP showing this level of significance in one test considering GxE interaction with their corresponding P-value when interaction was ignored.

