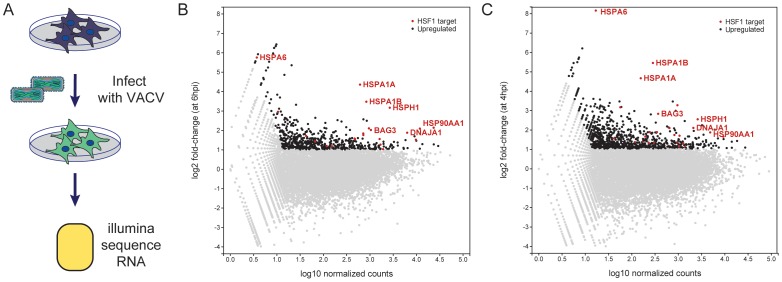
Figure 3. Host mRNA transcripts upregulated during VACV infection.
(A) Schematic of RNASeq Experiment. (B) Dots represent the change in expression of genes from 0 to 6 hpi (x-axis) and the average number of sequencing reads that align to each gene in both timepoints (y-axis). Genes with a fold change greater than 2 and more than 20 counts at 6 hpi are considered upregulated (black). HSF1-regulated genes upregulated during VACV infection are labeled in red (a subset is labeled with gene names). (C) Same analysis as in (B) using the WTA-A dataset at 4 hpi from Yang et al. [4].

