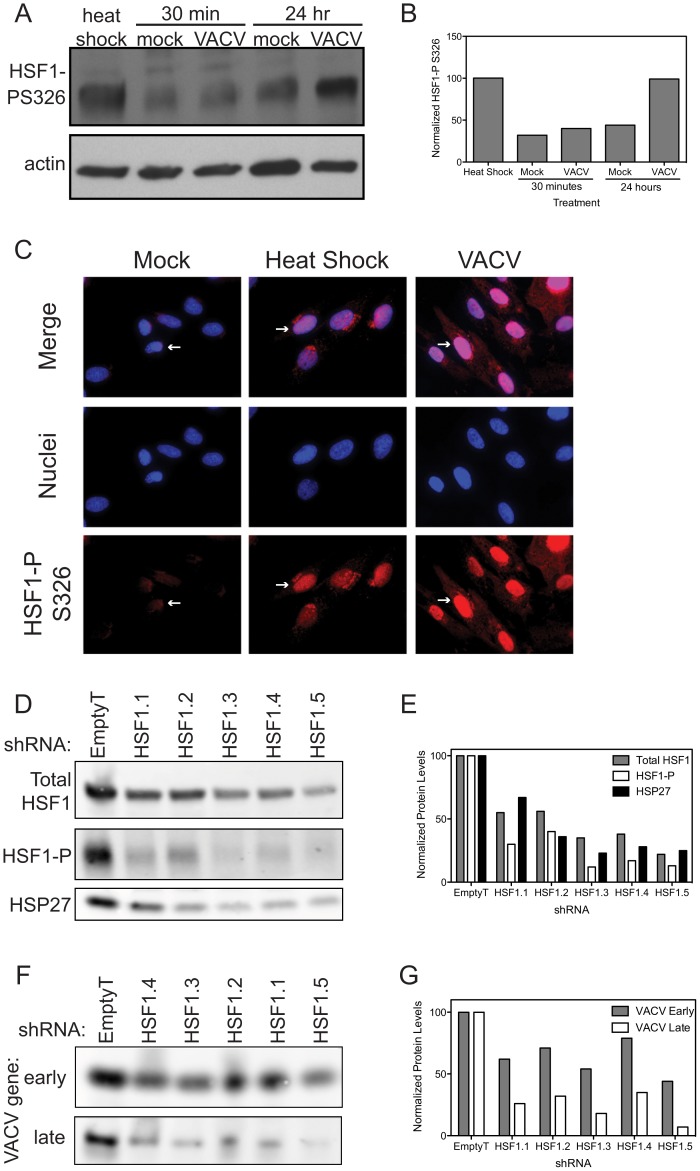
Figure 6. HSF1 is activated during VACV infection.
(A) Immunoblot showing HSF1 is phosphorylated on S326 following heat shock (42°C; lane 1). Basal levels of HSF1 phosphorylation are seen in mock and VACV infected cells 30 minutes post infection (lanes 2 and 3). Basal levels of phosphorylation are seen in mock-infected cells at 24 hpi (lane 4), while HSF1 phosphorylation increases during VACV infection by 24 hpi (lane 5). The actin loading control is shown for all samples. (B) VACV induces HSF1 phosphorylation to similar levels as heat shock. Graph shows densitometry quantification of the phosphorylated HSF1 present in each sample normalized to the actin loading control with heat shock phosphorylation levels set at 100%. (C) Immunofluorescence images in HFF-1 cells of HSF1 phosphorylation on S326 (red, white arrows) show protein localization in mock cells (low levels, cytoplasm), heat shocked cells (increased phosphorylation, nucleus) or VACV-infected cells 5 hours post infection with MOI 1 (increased phosphorylation, nucleus). DAPI staining (blue) identifies nuclei. (D–G) A549 cells with HSF1 knocked down by five independent shRNA lentiviral vectors or a control vector were infected with VACV at MOI 0.1 for 18 hours. (D) Cell lysates were immunoblotted for host proteins. Total HSF1, phosphorylated on S326 (activated) HSF1 and HSP27 are shown. The cells transduced with HSF1 shRNA express lower levels of HSF1 and HSP27 and show reduced phosphorylation of HSF1 upon VACV infection. (E) Graph shows densitometry quantification of the bands in (D). (F) Cell lysates were immunoblotted for VACV-expressed proteins. Shown are I3L, an early protein, and a late protein recognized by a polyclonal antibody that recognizes late viral proteins. When HSF1 levels are reduced, there are lower levels of VACV proteins expressed. (G) Graph shows densitometry quantification of the bands in (F).

