
Figure 4. Response-locked ERPs and scalp topographies for both experimental conditions.
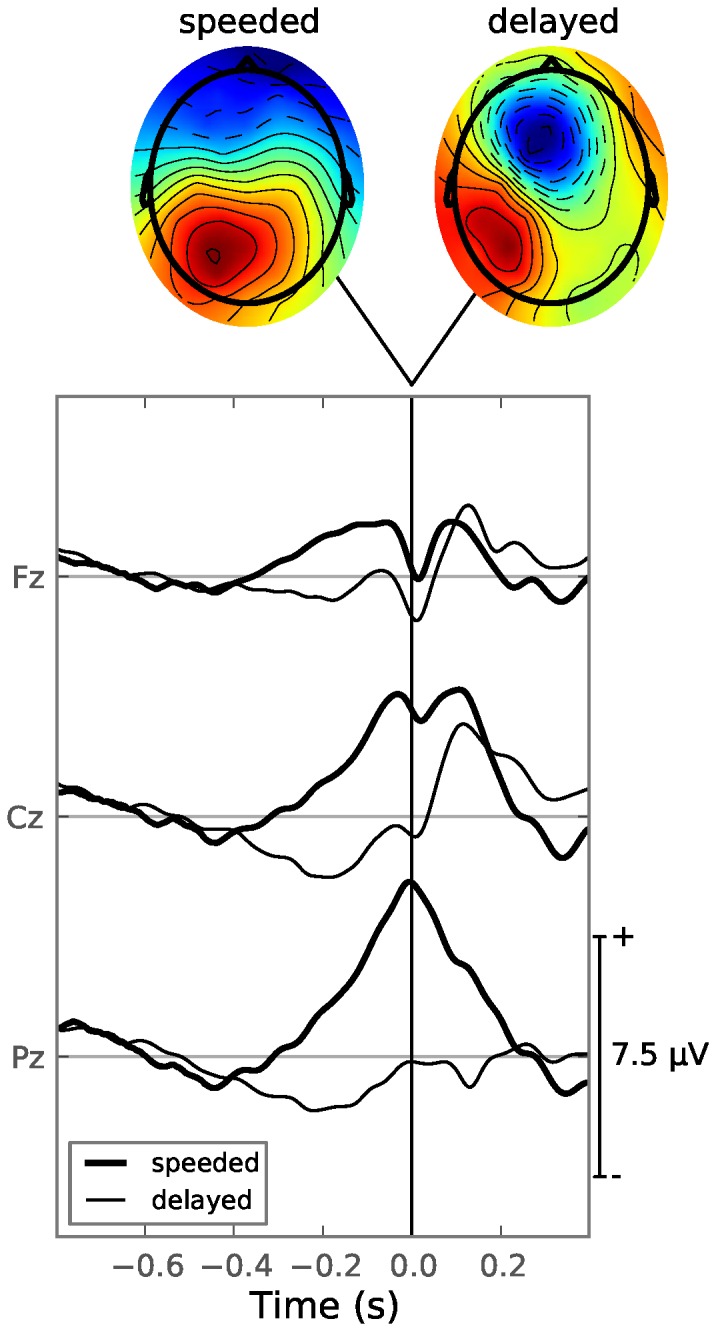
Shown are the grand response-locked ERPs across all bins and all subjects for the speeded condition (thick line) and delayed condition (thin line). Scalp topographies are given showing the voltage at 0 s, using red for positive and blue for negative values. Note that both scalp topographies use their own normalized scale.