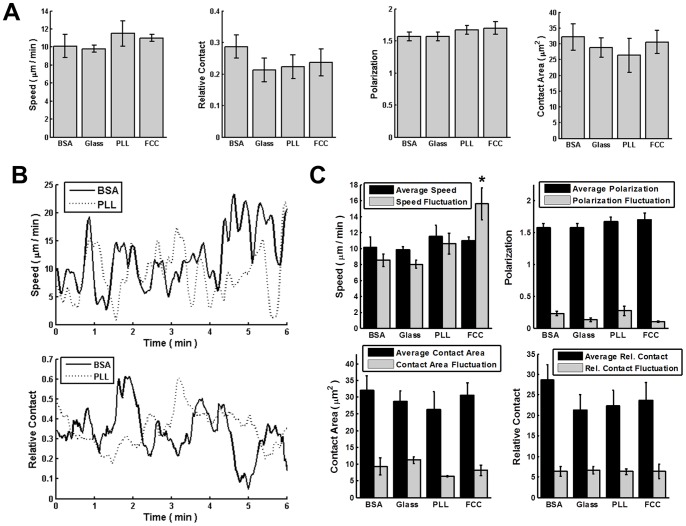
Figure 2. Cells migrate similarly on various substrates.
A. Quantification of average speed, relative contact area, absolute contact area, and polarization (see Material and Methods) for WT (AX3) cells on each surface. Time-lapse images were collected for 90 min and each cell was tracked for at least 5 min. Error bars indicate SD of three independent experiments, each with over 30 individual cells analyzed. All values were not statistically different (p>0.05; ANOVA). B. Quantification of temporal speed and relative contact area for WT (AX3) cells during migration on BSA and PLL coated surface. Speed and relative contact are averaged over all cells at corresponding time point. C. Comparison of average speed, relative contact area, absolute contact area, and polarization with the fluctuation of all these four measurements. *indicates statistical significance on speed fluctuation compared to the other three surfaces (p<0.05; ANOVA, Tukey test).

