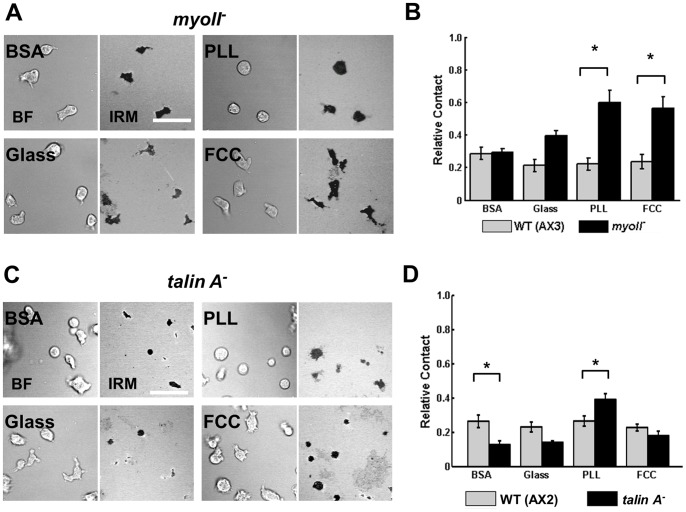
Figure 3. Myosin II and Talin A have different functions in cell-substrate adhesion.
A. Representative BF (left panels) and IRM (right panels) images of myoII − cells when plated on various surfaces. Scale bar = 35 µm. B. Quantification of the contact area of WT (AX3) and myoII − cells. C. Representative BF (left panels) and IRM (right panels) images of talin A − cells when plated on various surfaces. Scale bar = 35 µm. D. Quantification of the contact area of WT (AX2) and talin A − cells. For B and D, Error bars indicate SEM of 3 independent experiments, each with over 30 individual cells analyzed. *indicates statistical significance (p<0.05; T-test).

