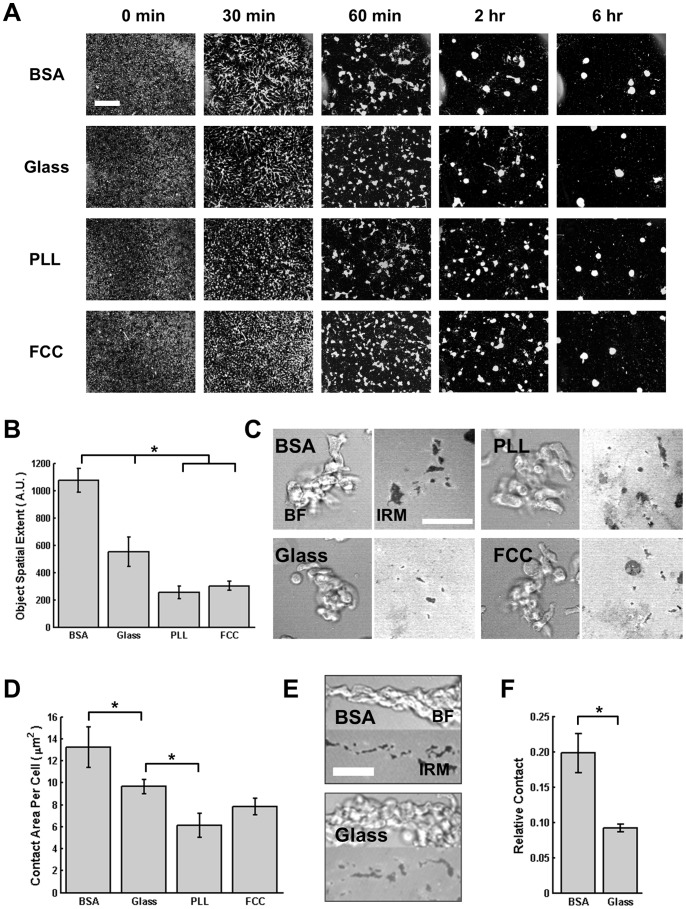
Figure 4. Surface Composition Affects Collective Cell Behavior.
A. Montage of images depicting WT (AX3) cells aggregating on the 4 different surfaces, shown at 5 different times. Cells are white on a black background. Scale bar = 400 µm. B. Spatial extent of objects in time-lapse images. Error bars indicate SEM of 3 independent experiments (see Fig. S4 for quantification details). * indicates statistical significance (p<0.05; ANOVA, Tukey test). C. Representative BF (left panel) and IRM (right panel) images for groups of cells on each surface. Scale bar = 50 µm. D. Graph showing the quantification of the average cell-surface contact for each cell, for 3 groups on each surface. For each group, the number of cells in the group was counted and the total contact area was calculated, giving the average contact area for each cell. Error bars indicate SEM. *indicates statistical significance (p<0.05; ANOVA, Tukey test). E. Representative BF (top panels) and IRM (bottom panels) images of streaming cells on BSA or glass. Scale bar = 35 µm. F. Graph depicting the IRM contact area relative to the bright-field contact area, for time-lapse images of streams on BSA and glass. Error bars indicate SEM of 4 streams, all from independent experiments. *indicates statistical significance (p<0.05; T-test).

