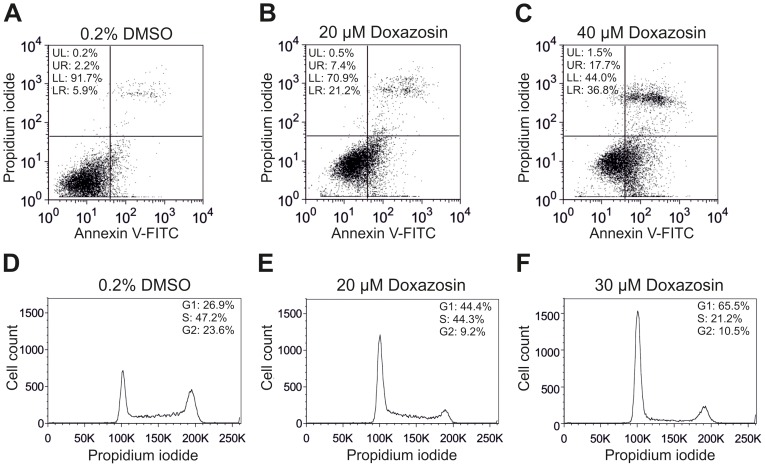
Figure 2. Quantification of apoptosis and cell cycle arrest in LNT-229 glioblastoma cells.
(A–C) Representative flow cytometric analyses indicate pro-apoptotic effects of doxazosin. Cells were treated with doxazosin for 24 h and analyzed by fluorescent annexin V labeling to detect phosphatidylserine (PS) externalization as early and specific apoptotic feature. Early apoptotic cells are located in the lower right (LR) quadrant. Propidium iodide co-staining served to indicate late apoptotic cells (upper right quadrant). (D–F) Cell cycle arrest associated with doxazosin treatment (24 h), demonstrated by flow cytometry. Propidium iodide fluorescence intensity correlates with the amount of cellular DNA content. Decreased diploid DNA content reflects a reduced number of cells in G2 and M phases after doxazosin application (E, F) compared to solvent controls (D), whereas the fraction of haploid cells in the G0/G1 phase was elevated. Results and data from representative experiments are shown.

